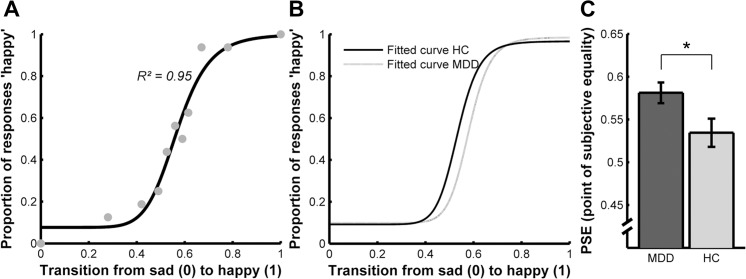
Fig 2. Negative perceptual bias in patients with MDD.
Patients with MDD recognized facial expression as happy if a higher proportion of happiness is expressed by the face compared to HC. MDD = major depressive disorder; HC = healthy controls (A): Example of a fitted logistic function to the behavioral responses for one representative participant. Intensity of the affective expression is displayed on the y-axis. Transition from sad to happy corresponds to values between 0 and 1 on the x-axis. 0 corresponds to the fully sad expression, 1 is attributed to a happy expression. A y-value of 1 corresponds to a classification of the face as happy in each trial and a y-value of 0 to the response ‘sad’ in each trial, 0.5 is assigned if a face is equally often classified as happy and sad. The x-value indicates the PSE of the curve corresponding to the criterion for the categorical shift. The categorical shift from sad to happy indicates the morphed facial expression that is equally often categorized as happy and sad. (B): Bar plot, displaying the mean PSE at T1 for both groups. *p = 0.025. Error bars denote within-subject standard errors of mean [53].

