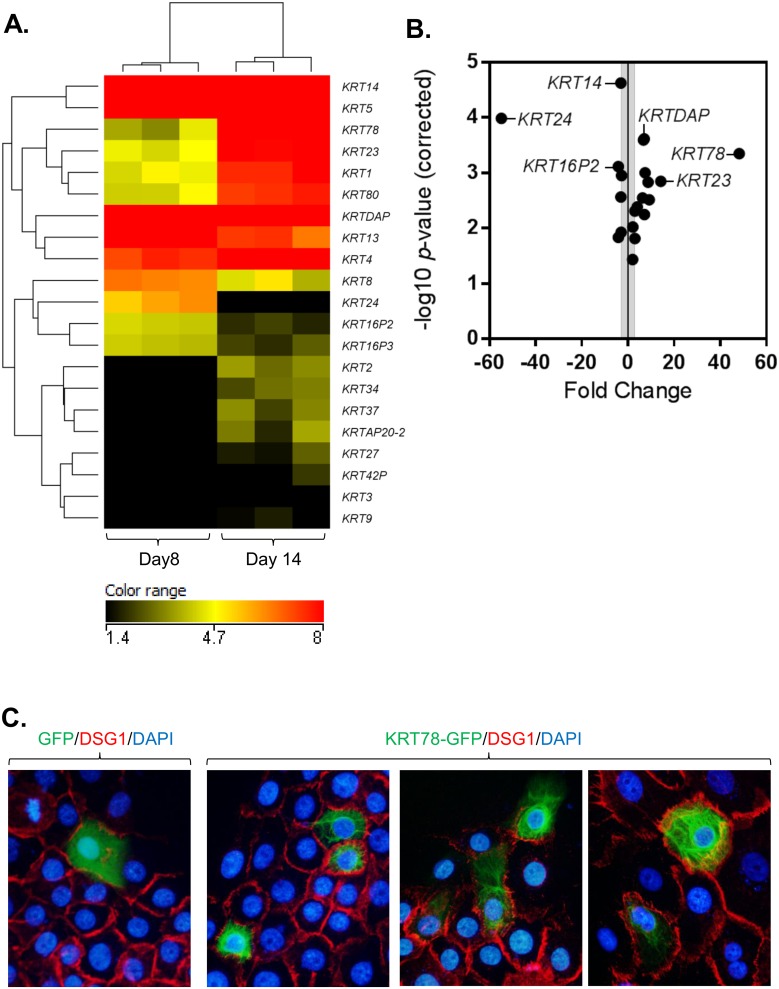
Fig 3. Differential keratin expression during differentiation with ALI culture.
Clustered heatmap showing the log2 FPKM values (A) and volcano plot showing the fold change and—log10 P-values (B) of the 21 keratin gene family members significantly changed in the air-liquid interface (ALI) culture system at day 14 compared to day 8 (P < 0.05, fold change > 2). Immunofluorescence staining of EPC2-hTERT cells transfected with GFP (empty vector control) or KRT78-GFP (green) (C). Cells were co-stained for DSG1 (red) and nuclei are stained with DAPI (blue). Images are representative of 3 independent experiments and taken at 400X magnification.

