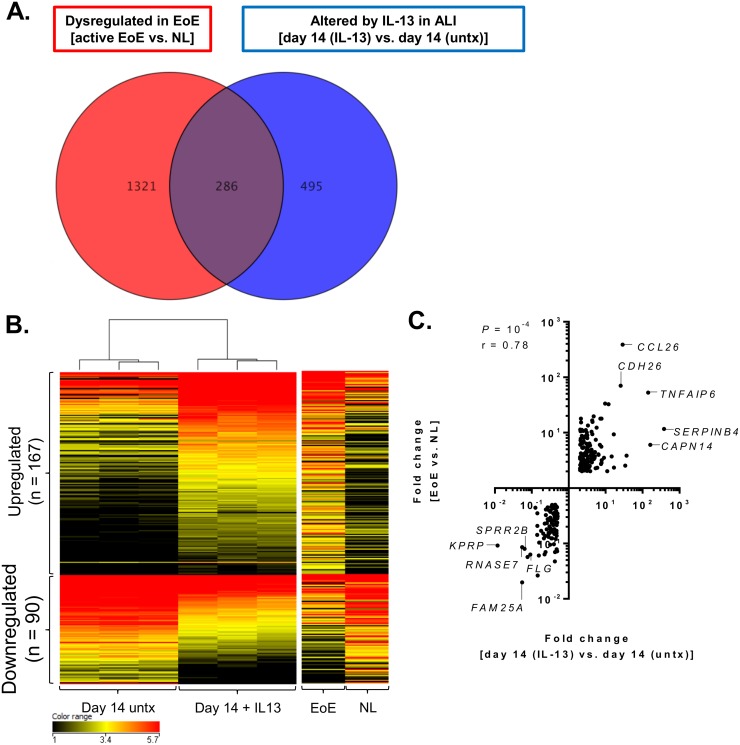
Fig 5. Identification of disease-associated genes in the ALI system.
Venn diagram depicting the number of genes dysregulated in the inflamed esophageal tissue of patients with active eosinophilic esophagitis (EoE) compared to healthy (NL) controls (P < 0.05, fold change > 2, n = 1,607) and the number of genes altered in the air-liquid interface (ALI) after prolonged IL-13 exposure (day 14 [IL-13] compared to day 14 [untx]; P < 0.05, fold change > 2; n = 781) (A). Clustered heatmap showing the log2 FPKM values (B) and fold change correlation (C) of the 257 genes similarly dysregulated in the ALI after prolonged IL-13 exposure and in the inflamed esophageal tissue of patients with active eosinophilic esophagitis (EoE). Untx, untreated.

