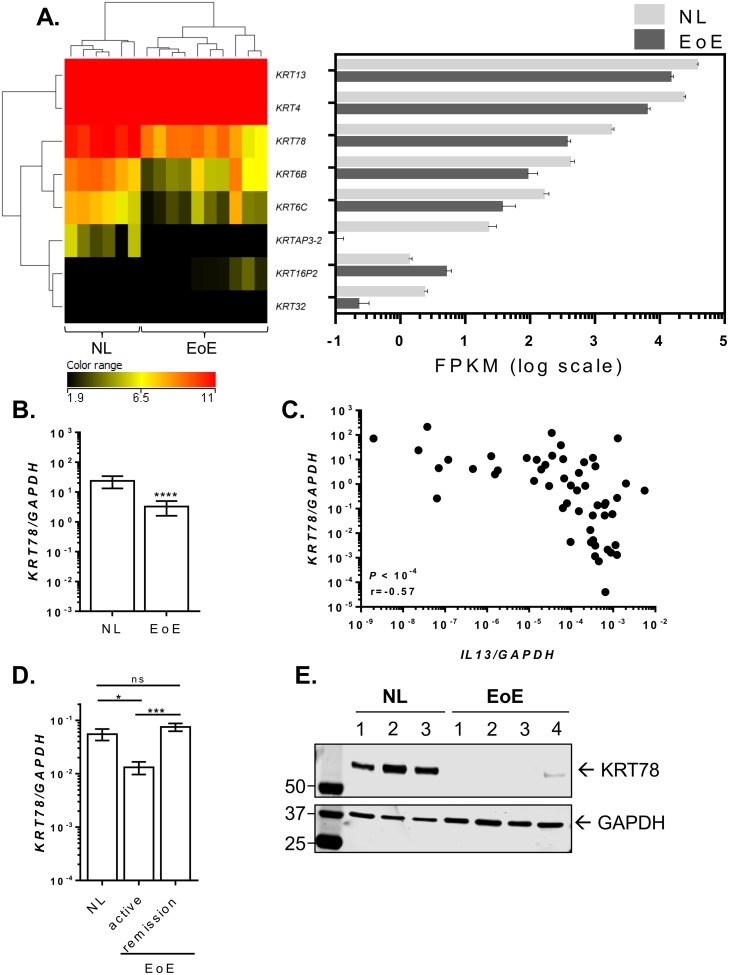
Fig 7. Decreased KRT78 expression in EoE.
Clustered heatmap showing the log2 FPKM values of differentially expressed keratins in the esophagus of healthy controls (NL) and patient with active EoE (P < 0.05, fold change > 2.0) (A). The right panel depicts the FPKM of corresponding keratin genes in log scale. Quantitative PCR analysis of KRT78 expression in esophageal biopsies from NL (n = 23) and patients with active EoE (n = 49) (B). Correlation between esophageal expression levels of KRT78 and IL13 in NL (n = 23) and patients with active EoE (n = 34) (C). Quantitative PCR analysis of KRT78 expression in esophageal biopsies from NL (n = 11) and patients with active EoE (n = 12) and in disease remission (n = 11) (D). Western blot analysis of KRT78 (upper panel) and GAPDH (lower panel) expression in esophageal biopsy protein lysates from NL (n = 3) and patients with active EoE (n = 4) (E). Data in (B) and (D) are represented as mean with SEM. *, P < 0.05; ***, P < 10–3; ****, P < 10-4. Ns, not significant.

