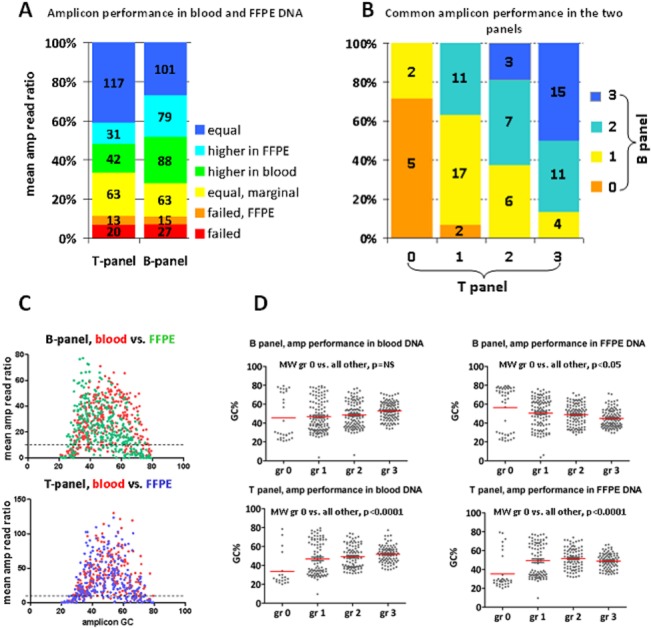
Fig 3. Performance of individual amplicons in blood and FFPE DNA.

A. Amplicon performance grading did not significantly differ between the two panels. Columns: combined evaluation of each panel in blood and FFPE. Numbers within boxes: actual amplicon number per category, as indicated. B. Performance of the 83 common amplicons was significantly different in the two panels (p<0.0001). The most unstable amplicons were of performance grade 1 and 2. C. A non-linear distribution of mean read ratios according to amplicon GC content was observed. Read ratios of amplicons with >75% or <25% GC content were almost uniformly below the 10th percentile cut off (dotted line in both graphs) (Kruskal-Wallis test p<0.0001 for each panel and sample group). D. Very high and very low GC content was significantly associated with failed amplicons (gr 0). This pattern was also present for the B-panel in blood samples, despite the absence of statistical significance. Except for these extreme cases, however, all other amplicon categories did not significantly differ with regards to GC%.
