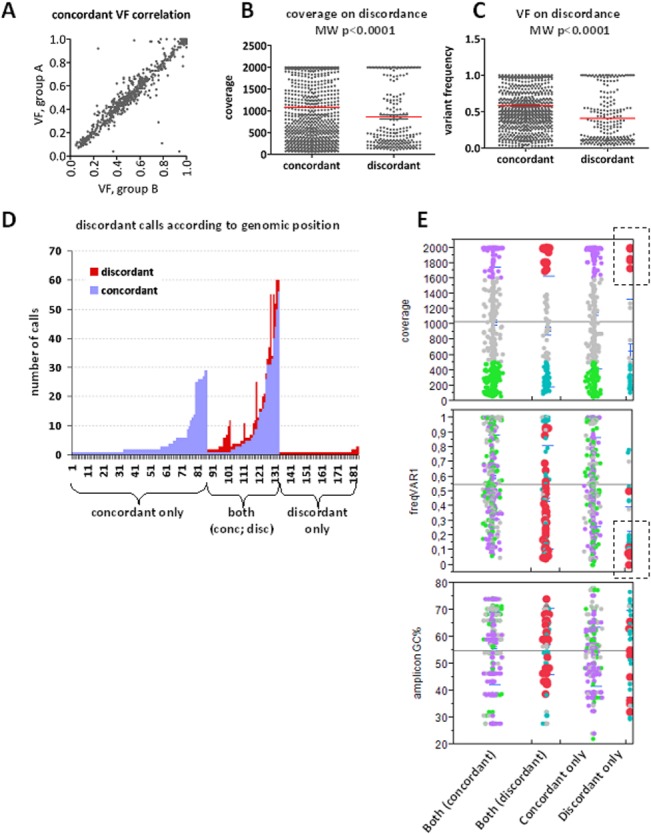
Fig 5. Effect of coverage and frequency on variant concordance with custom panels on FFPE samples.

A: Variant frequency (VF) was highly preserved in replicate measurements from the same samples. B and C: Concordant variants had statistically significant higher coverage and frequency as compared to discordant ones (red lines: mean values). However, both high and low coverage and frequency were observed for discordant variants and followed the same bimodal pattern in these categories. D. Out of the 181 different positions accounting for the 1267 variants under study, calls were constantly concordant in 83 (45.8%), partially concordant in 26.0%, and constantly discordant in 28.2%. E. Distribution of VF and amplicon GC% according to high and low coverage for the categories indicated on the bottom of the graphs. Red and lilac dots: high coverage in discordant and concordant variants, respectively; turquoise and green dots: low coverage, respectively. Among discordant only variants, those of high coverage were almost exclusively of low VF (boxed).
