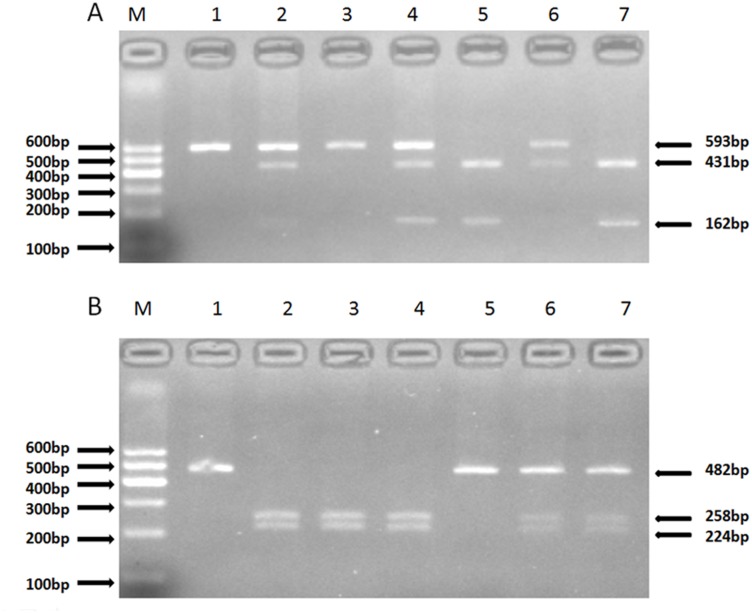
Fig 1. The restriction fragment length polymorphism analysis to determine the genotype.
A. For rs1800871, the TT genotype shows one 593-bp band (1 and 3); the CC genotype shows two bands at 431 bp and 162 bp (5 and 7); and the CT genotype shows three bands at 593 bp, 431 bp and 162 bp (2, 4 and 6). B. For rs1800872, the CC genotype shows one 482-bp band (1 and 5); the AA genotype shows two bands at 258 bp and 224 bp (2, 3 and 4); and the AC genotype shows three bands at 482 bp, 258 bp and 224 bp (6 and 7).

