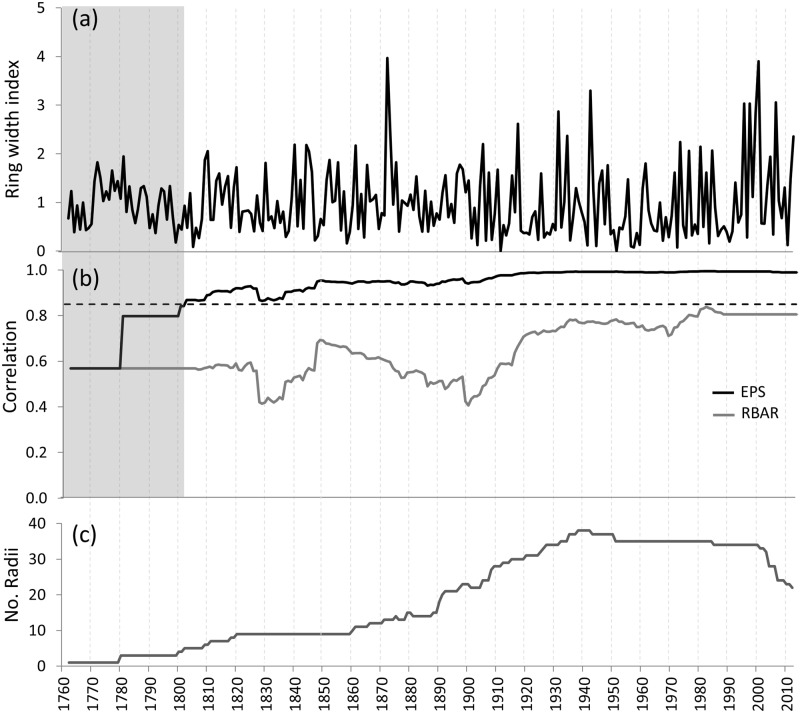
Fig 2. The Callitris ring-width chronology from the Pilbara region in northwest Australia.
(a) Ring-width indices, (b) measures of signal strength, the (RBAR) and the expressed population signal (EPS), and (c) sample depth. The black dashed line indicates the accepted level of confidence of the EPS (0.85). The shaded area indicates the point (1802) when the EPS drops below 0.85 and therefore when the chronology is considered to be less reliable.

