
Fig 5. Significant (p < 0.05) correlations between the summer-autumn (Dec–May averaged) Southern Annular Mode (SAM) and precipitation across Australia (1957–2012).
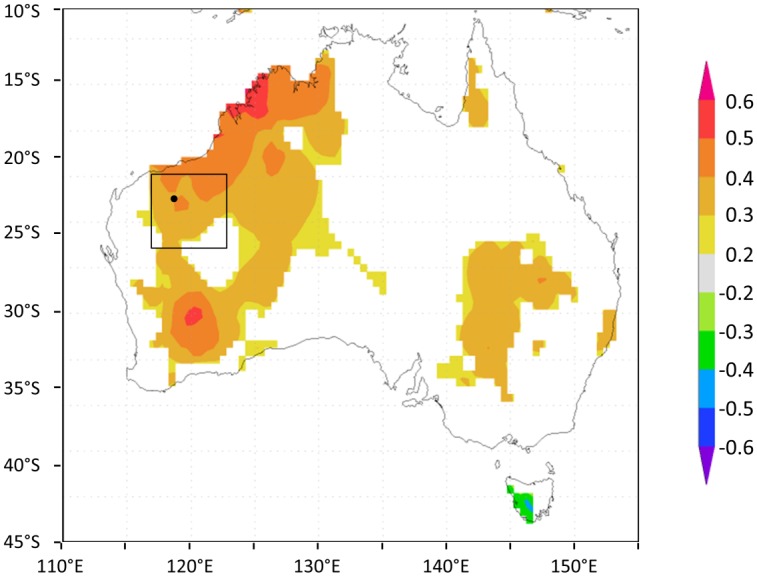
Image produced in Climate Explorer (climexp.knmi.nl). SAM data are from the British Antarctic Survey and precipitation data are CRU version 3.22 0.5° gridded data area-averaged over the 5° study region (117–122°E, 21–26°S).