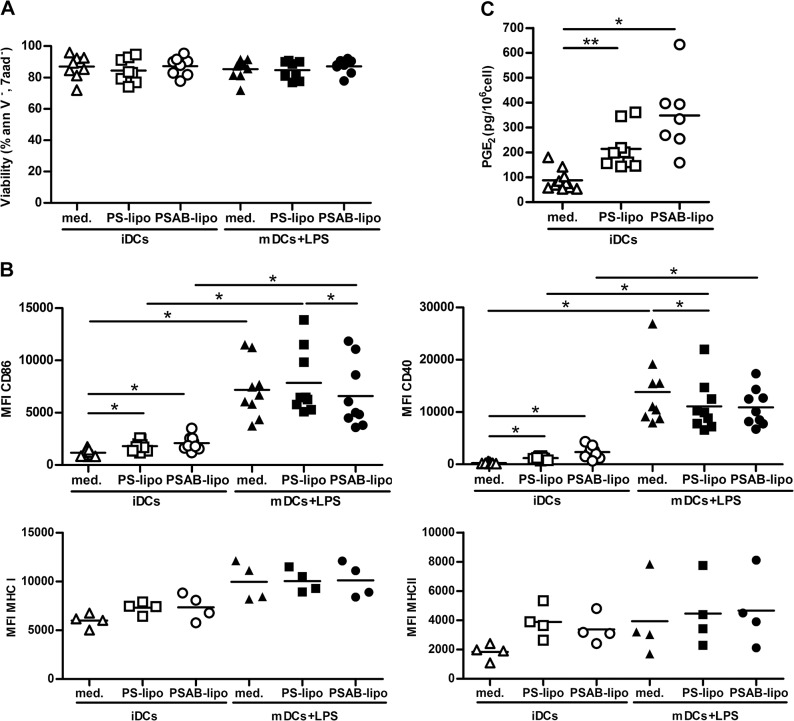
Fig 2. Effects of the capture of PS-liposomes in DCs phenotype.
A) DCs viability assessed by annexin V and 7aad staining. White symbols represent iDCs, before (triangles) and after the capture of PS-liposomes (squares) or PSAB-liposomes (circles), 24 hours after culture. Black symbols represent viability of mature DCs (mDCs) before (triangles) and after the capture of PS-liposomes (squares) or PSAB-liposomes (circles) after proinflammatory stimulus (LPS). Lines show the mean of at least eight independent experiments. B) Median of fluorescence intensity (MFI) for CD86, CD40, MHC Class I and MHC Class II membrane expression on DCs before and after liposome capture (white symbols) and after exposure to LPS (black symbols). Lines show the mean of at least four independent experiments. Comparisons within each group and between paired maturation conditions showed significant differences (*p<0.05, Wilcoxon test). C) Quantification of the PGE2 production by immature DCs (iDCs) in culture medium (med, white triangles), loaded with PS-liposomes (PS-lipo, white squares) or PSAB-liposomes (PSAB-lipo, white circles), after 24 hours of culture. Data are represented as pg/106 cells. Lines show the mean of a minimum of seven independent experiments. Comparisons between groups showed significant differences (**p<0.01 and *p<0.05, Wilcoxon test).

