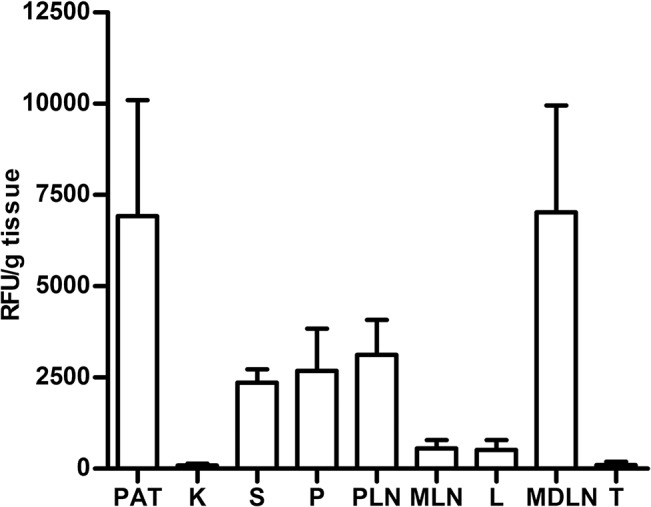
Fig 4. Tracking of PS-liposomes.

Histogram of ex vivo relative fluorescent signal (RFU, Relative Fluorescence Units/g tissue) in organs from NOD mice 24 hours after the administration of labeled PS-liposomes (Alexa Fluor 750). PAT, perigonadal adipose tissue; K, kidney; S, spleen; P, pancreas; PLN, pancreatic lymph nodes; MLN, mesenteric lymph nodes; L, liver; MDLN, mediastinal lymph nodes; T, thymus. Results are mean±SEM of three independent experiments.
