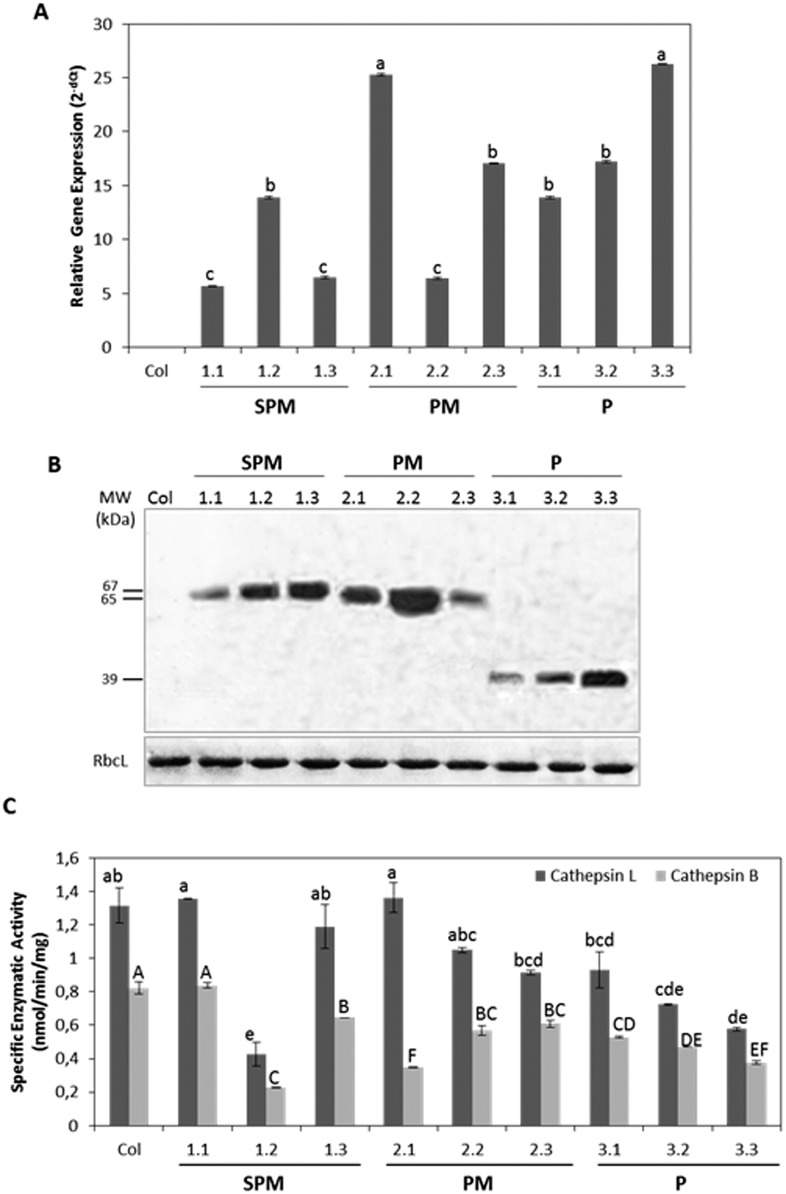
Fig 3. Analysis of the mRNA, protein expression and proteolytic activities of the transformed and control Arabidopsis plants.
A. Analysis of the mRNA expression levels of T2 transformed lines and non-transformed control (Col) by RTq-PCR. Values expressed as the relative mRNA levels of the different transgenes were normalized to the Arabidopsis ubiquitin gene expression. B. Protein content detected by western-blot analysis of T2 transformed lines and non-transformed control (Col), using 10 μg of protein/lane and anti-GFP and anti-Rubisco antibodies. Large subunit of Rubisco (RbcL) was used as control loading. MW: molecular weights are indicated in kDa. C. Proteolytic activities of T2 transformed lines and non-transformed control (Col) expressed as nmoles/min/mg, using specific substrates of cathespin L- and B-like. Data are mean ± SE of triplicate measurements of each sample. Different letters indicate significant differences (P<0.05, Tukey's HSD). Transgenic plants were: SPM (lines 1.1, 1.2, 1.3), PM (lines 2.1, 2.2, 2.3) and P (lines 3.1, 3.3, 3.3).

