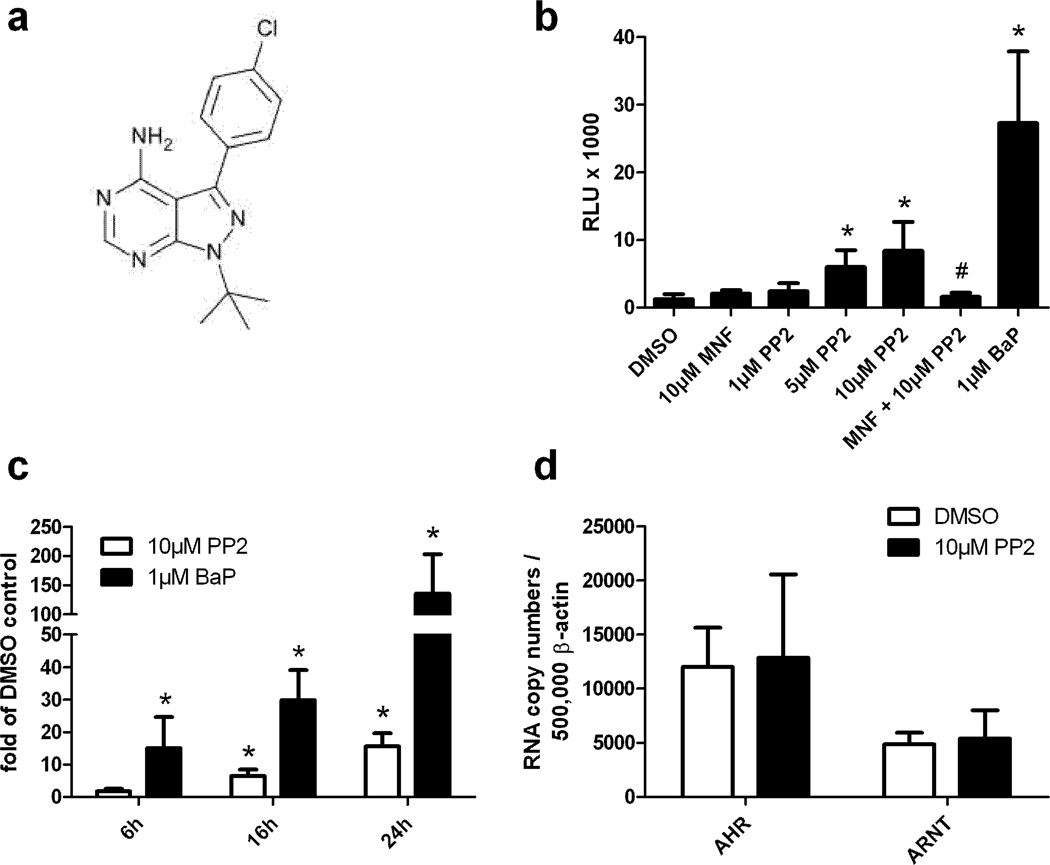
Figure 1. PP2 induces XRE-dependent reporter gene activity and CYP1A1 mRNA expression in HepG2 cells.
A. Structure of PP2. B. XRE-HepG2 cells were treated with PP2 (1µM, 5µM, 10µM), 10µM MNF, 10µM MNF plus 10µM PP2, 1µM BaP or solvent. After 24h luciferase activities were determined and normalized to protein content. Results are shown as relative light units (RLU). *, significantly increased compared to solvent-treated samples, #, significantly decreased compared to 10µM PP2-treated samples. C. HepG2 cells were exposed for 8h, 16h, and 24h to 10µM PP2 or solvent. CYP1A1 and β-actin gene expression was analyzed by quantitative real-time PCR. Results are shown as fold of solvent ctrl. *, significantly increased compared to solvent-treated samples. D. HepG2 cells were treated with 10µM PP2 or solvent. After 24h cells were harvested and gene expression of AHR, ARNT, and β-actin was analyzed by quantitative real-time PCR.

