
Figure 1. Quantitative ultrasound transducer, region of interest, and the average power spectra.


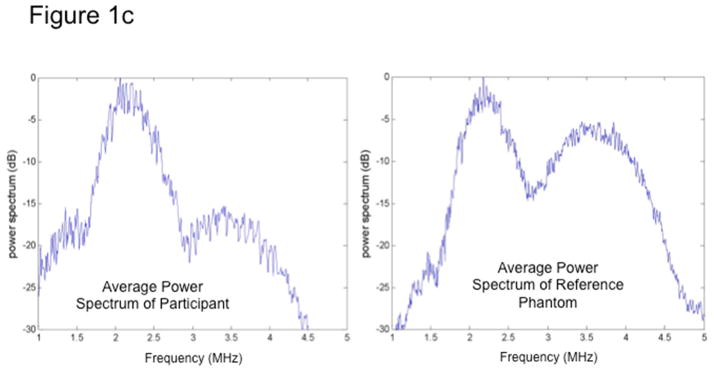
Fig 1a. The QUS transducer captures images and BSC data on both a participant’s liver (left) and on a reference phantom (right). Analyst draws field of interest (FOI) for signal processing.
Fig 1b. Transducer signals captured by the QUS comprise of raw radiofrequency data in lines of pressure waves, one of which is plotted here.
Fig 1c. The average power spectra over a sub-region of interest (sub-ROI) from a participant (left) and the reference phantom (right). Participants’ spectra vary from that of the phantom due to different acoustic properties; thus, the reference phantom can be used to calibrate participant data and correct for total attenuation of tissue signals in the overall FOI.