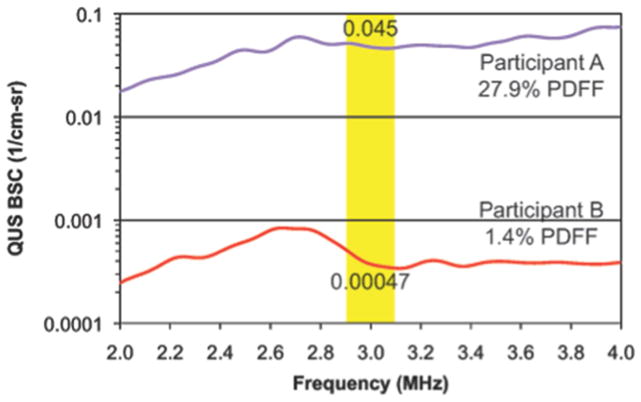
Figure 3. Backscatter spectra averaged over a field of interest between two participants with different degrees of MRI-PDFF determined hepatic steatosis.
Two participants, as illustrated in Figure 2, with different values of MRI-PDFF (Participant A, 27.9%; Participant B, 1.4%) are compared. The plots show QUS BSC as a function of frequency. Participant A (with NAFLD) shows significantly higher BSC than Participant B (non-NAFLD control) across the entire frequency bandwidth. The yellow shading depicts the narrow bandwidth (2.9–3.1 MHz) for the BSC parameters analyzed in this study. The numbers within the shaded areas are the mean values of BSC within that bandwidth, for each participant.

