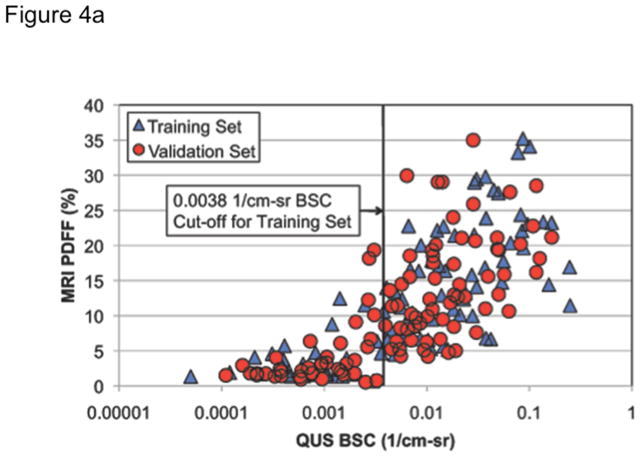
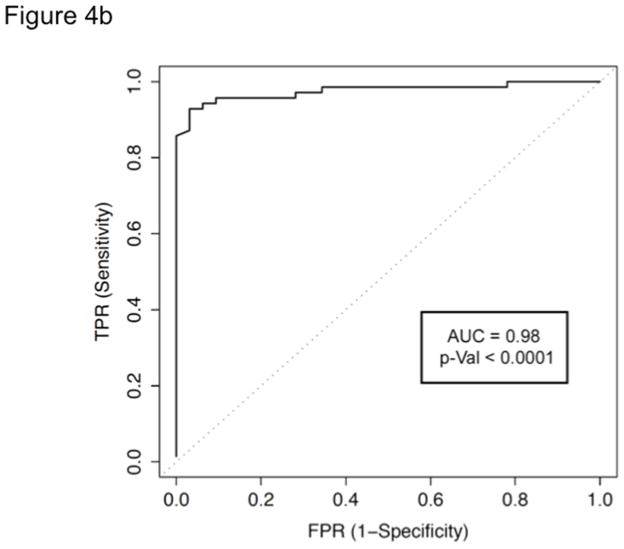
Figure 4. Figure 4a Correlation between BSC and MRI-PDFF (≥5%) in training and validation groups (n = 204), with the optimal BSC cut-off and corresponding ROC curve for the diagnosis of hepatic steatosis.
When BSC is correlated with MRI-PDFF (QUS frequency of 3 MHz), BSC exhibited a Spearman’s rho in the training and validation groups of 0.82 and 0.79, P < .0001, respectively. Overall, BSC ρ=0.80 (P < .0001). At MRI-PDFF ≥5%, the optimal BSC cut-off was 0.0038 1/cm-sr in the training set for the diagnosis of NAFLD.
Figure 4b ROC curve for the diagnosis of hepatic steatosis with BSC as defined by MRI-PDFF ≥5% at the optimal QUS BSC cut-off in the training group. Backscatter coefficient of 0.0038 1/cm-sr exhibits an AUC of 0.98.


