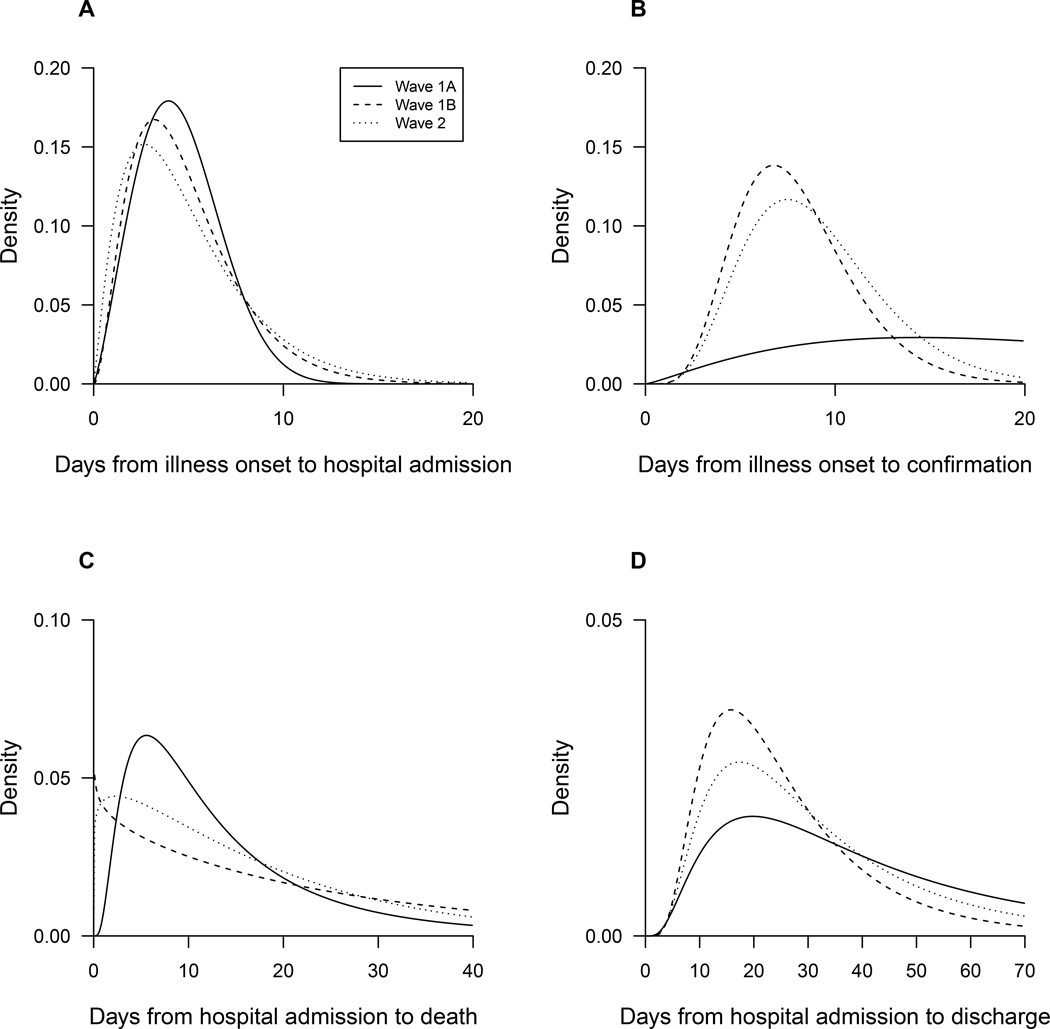
Figure 3.
Comparisons of epidemiologic distributions between waves. Panel A: the time from illness onset to hospital admission. Panel B: the time from illness onset to laboratory confirmation. Panel C: the time from hospital admission to death. Panel D: the time from hospital admission to discharge. The periods covered by waves 1A, 1B and 2 are shown in Figure 1.

