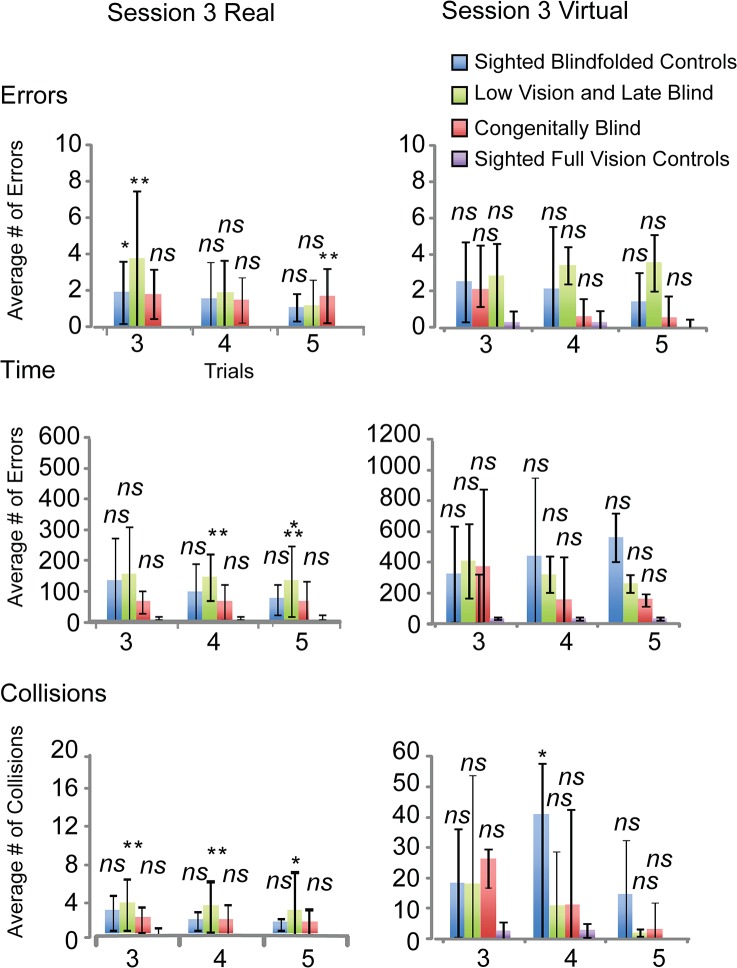
Fig 6. Real and Virtual performances on the last session.
Differences between the initial performance of the sighted full vision controls and the other groups on the third session. All statistical comparisons were made with the initial performance of the sighted full vision controls. *p<0.05; **p<0.01; ***p<0.001.

