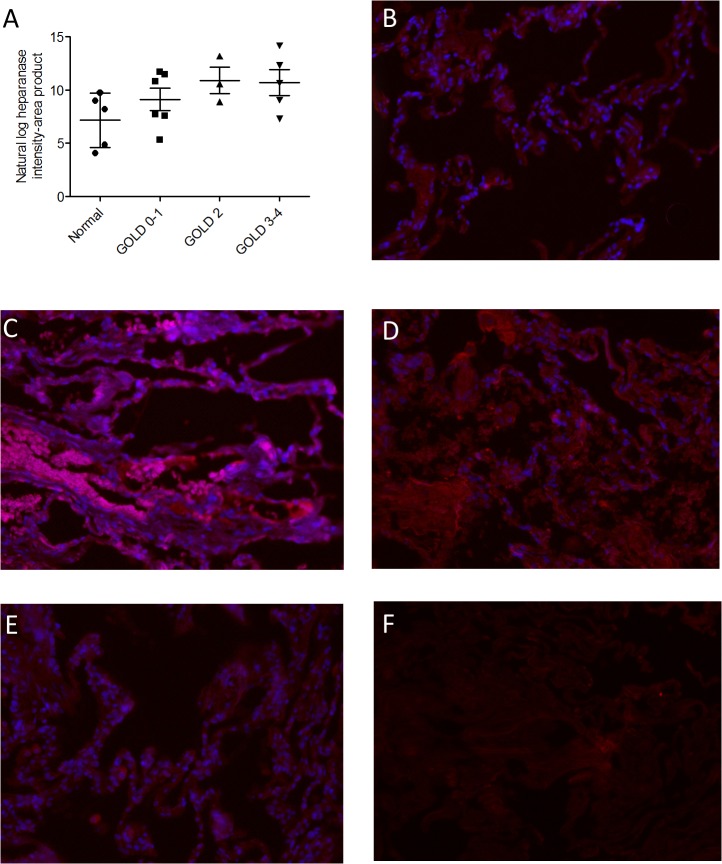
Fig 4. Heparanase expression in lung tissue from normal subjects and COPD patients of varying severity.
Each point represents the intensity of staining for heparanase expression in normal human lung tissue and in subjects with varying severities of COPD (A). Representative images are shown (B-F reflecting Gold 0–1, Gold 2, Gold 3–4, healthy subject, and isotype control, respectively. Red: heparanase; blue: DAPI (DAPI not performed for isotype control). Image brightness was uniformly adjusted for clarity and all heparanase quantification was performed using unadjusted (raw) images. Magnification was 40 x for all images. The data was analyzed as continuous variables and there was a significant linear trend (post-ANOVA, r-squared = 0.27 and p = 0.029). Horizontal line represents mean and limits represent SEM.

