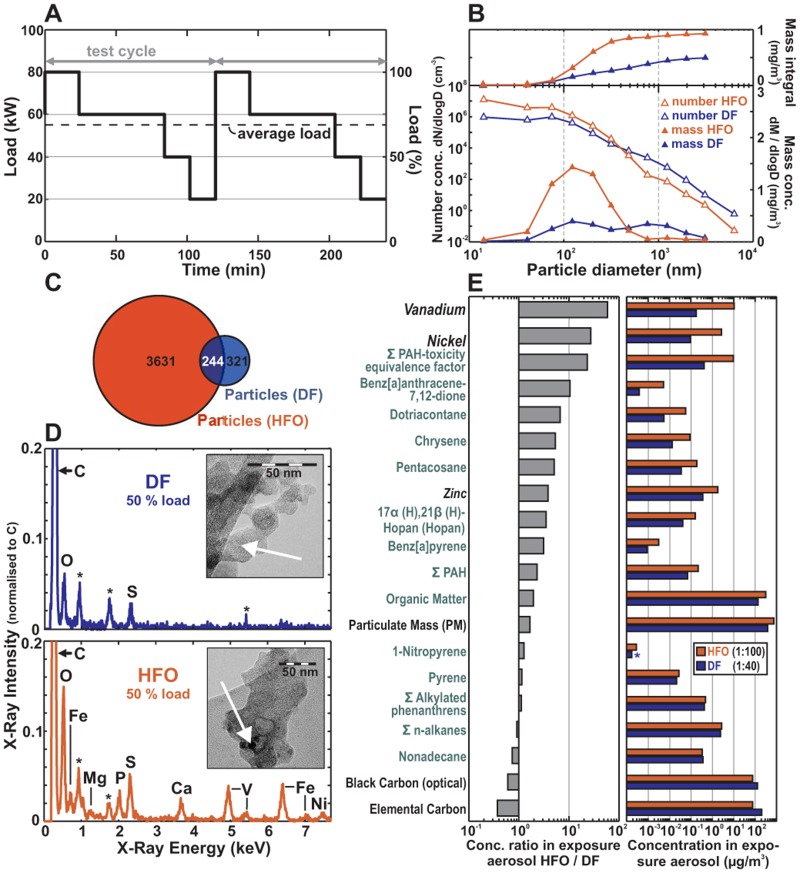
Fig 2. Chemical and physical aerosol characterisation.
(A) The ship diesel engine was operated for 4 h in accordance with the IMO-test cycle. (B) Approximately 28 ng/cm2 and 56 ng/cm2 were delivered to the cells from DF and HFO, respectively, with different size distributions. The HFO predominantly contained particles <50 nm, and the DF predominantly contained particles >200 nm, both in mass and number. (C) Number of chemical species in the EA particles. (D) Transmission electron microscope (TEM) images and energy-dispersive X-ray (EDX) spectra of DF-EA and HFO-EA; heavy elements (black speckles, arrow); and contributions of the elements V, P, Fe and Ni in the HFO particles using EDX (* = grid-material). (E) Exemplary EA concentrations (right) and concentration ratios (left) for particulate matter-bound species. For all experiments, n = 3.

