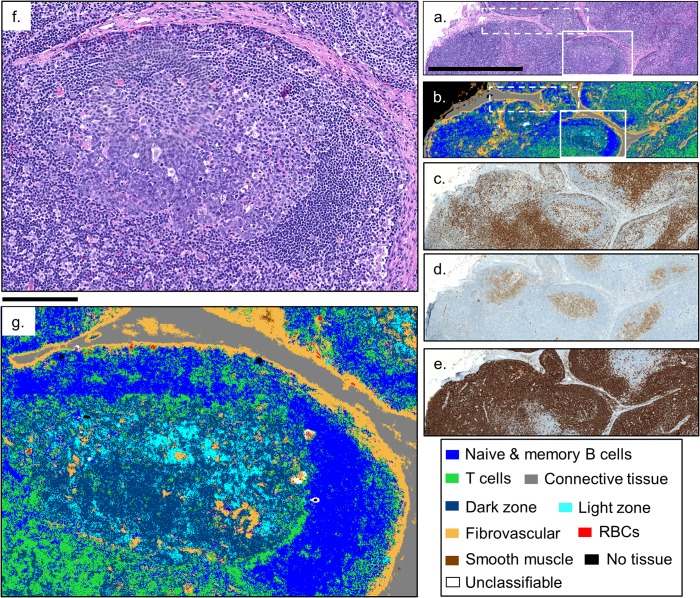
Fig 3. Classification of an HD IR image of a normal submandibular lymph node.
A qualitative comparison of the classified HD IR image, (b), can be made with the stained serial sections (a) H&E, (c) CD3+, (d) CD10+, and (e) CD20+, showing excellent agreement. Zooming in on the secondary follicle in the HD classified image, (g), shows that the classifier is capturing the naïve B cell mantle (blue), T cells (green), and the light and dark zone regions of activated B cells (cyan and dark blue, respectively) of the germinal center. The dashed boxes correspond to the images shown in Fig 1. The solid bars in (a) and (f) are 1 mm and 175 μm, respectively.

