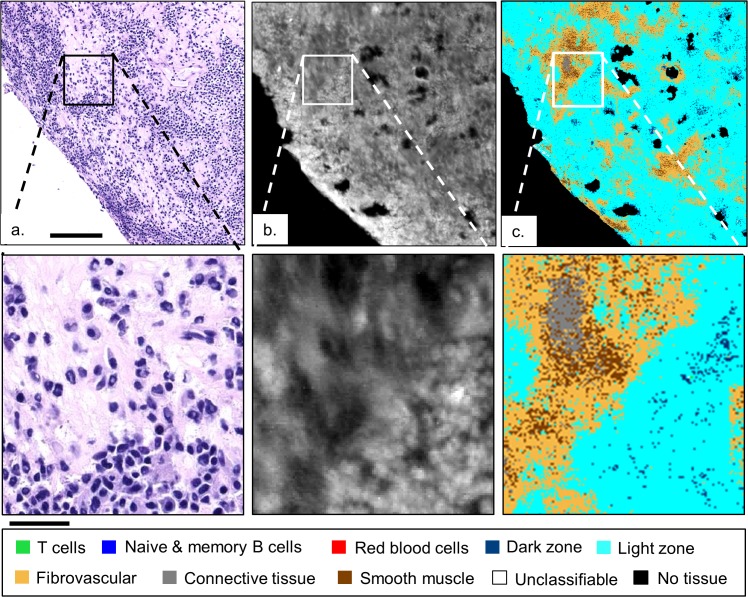
Fig 6. Comparison of malignant lymphoid tissue.
H&E stained serial section (a), HD IR image at 3300 cm-1 intensity (b), and classified image, (c), from Fig 5 (bottom left) confirm the resolving power of HD spectroscopic imaging and the consistent light zone B-cell classification of the abnormal lymph node. The solid bar in (a) and below the zoom are 140 and 35 μm, respectively.

