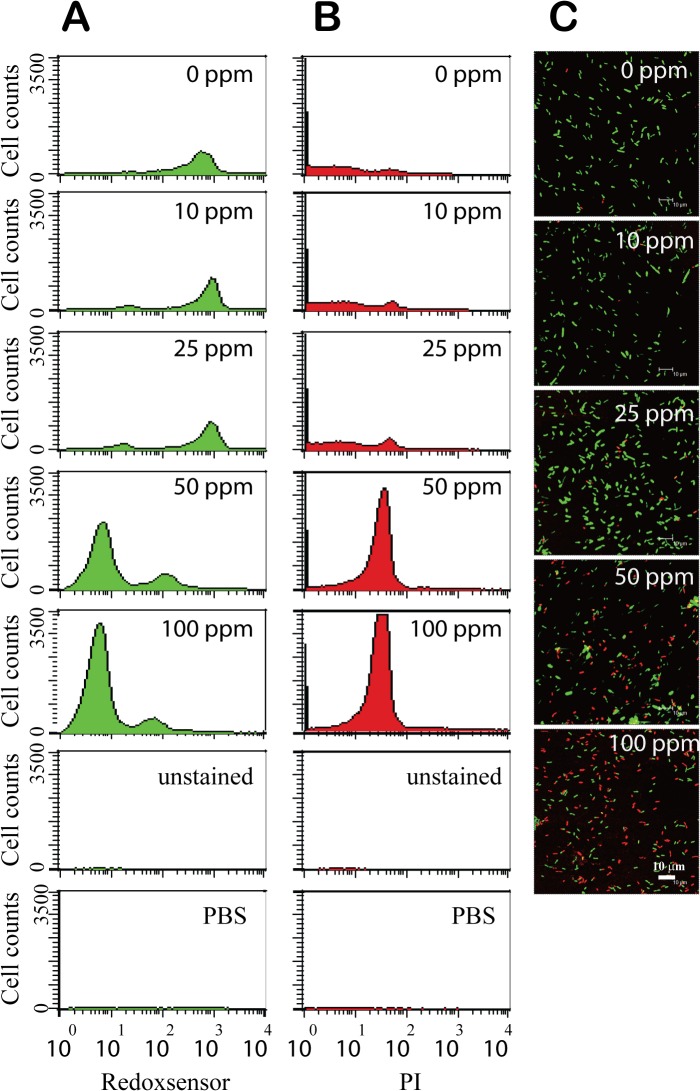
Fig 4. Flow cytometry and fluorescent micrograph analysis of RedoxSensor activity in B. subtilis.
Wild-type bacteria were grown for 3 hrs at ZnO-NP concentrations of 0 ppm, 10 ppm, 25 ppm, 50 ppm, 100 ppm. Unstained samples and PBS buffer alone were used as controls. The X axis indicates RedoxSensor or PI fluorescence intensity (arbitrary units: au), and the Y axis indicates cell counts. A. Flow cytometry analysis of Redoxsensor activity, and B. Flow cytometry analysis of PI activity. C. Fluorescent micrographs of B. subtilis cells indicate RedoxSensor activity or PI fluorescence after incubation with different concentrations of ZnO-NPs for 3 h. Redoxsensor activity presents a false green color. PI presents a false red color. Scale bar: 10 μm.

