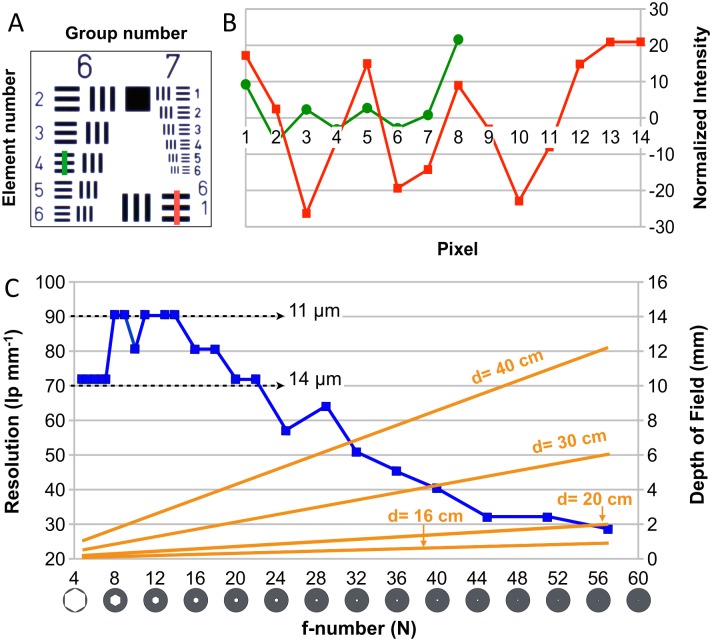
Fig 2. Inferring texture resolution.
A) The USAF 1951 test target. B) Intensity variations along a line of pixels across the test-chart pattern in the 6/4 (green) and 6/1 (red) group/element numbers. The green curve indicates a resolution of at least 11μm. C) An increase in f-number (N), i.e., a decrease of aperture size (as indicated with the camera shutter diagram) causes (i) a decrease in resolution (blue line; left vertical axis) because of more intense diffraction but (ii) an increase of the depth of field (DOF; right vertical axis, orange lines for four distances between object and camera lens).

