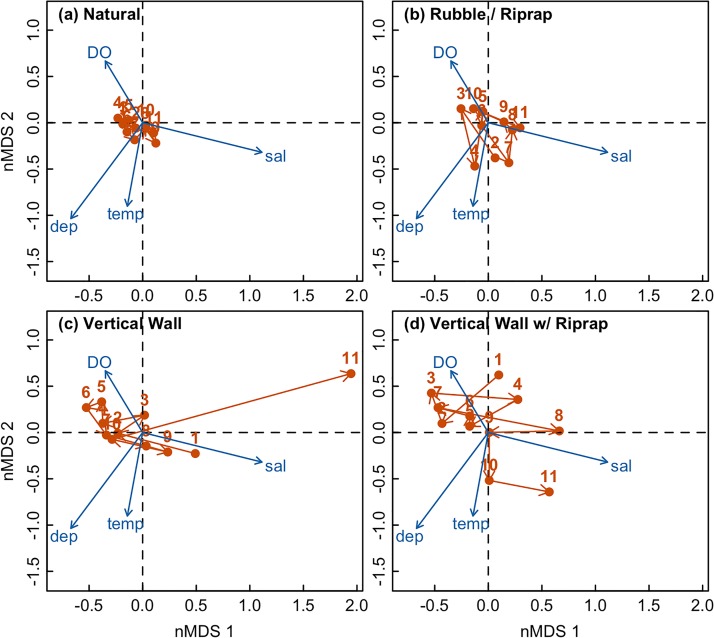
Fig 3. Non-metric multidimensional scaling (nMDS) plots for fish communities associated with each shoreline type.
A single nMDS analysis was performed on the entire dataset (2-D stress = 0.13) and the results were plotted on four different panels based on shoreline type: (a) Natural, (b) Rubble with Riprap, (c) Vertical Wall, (d) Vertical Wall with Riprap. Blue vectors and labels indicate explanatory variables that are significantly correlated with the nMDS axes. Red arrows indicate the trajectory of communities over time, with the red labels representing year number.

