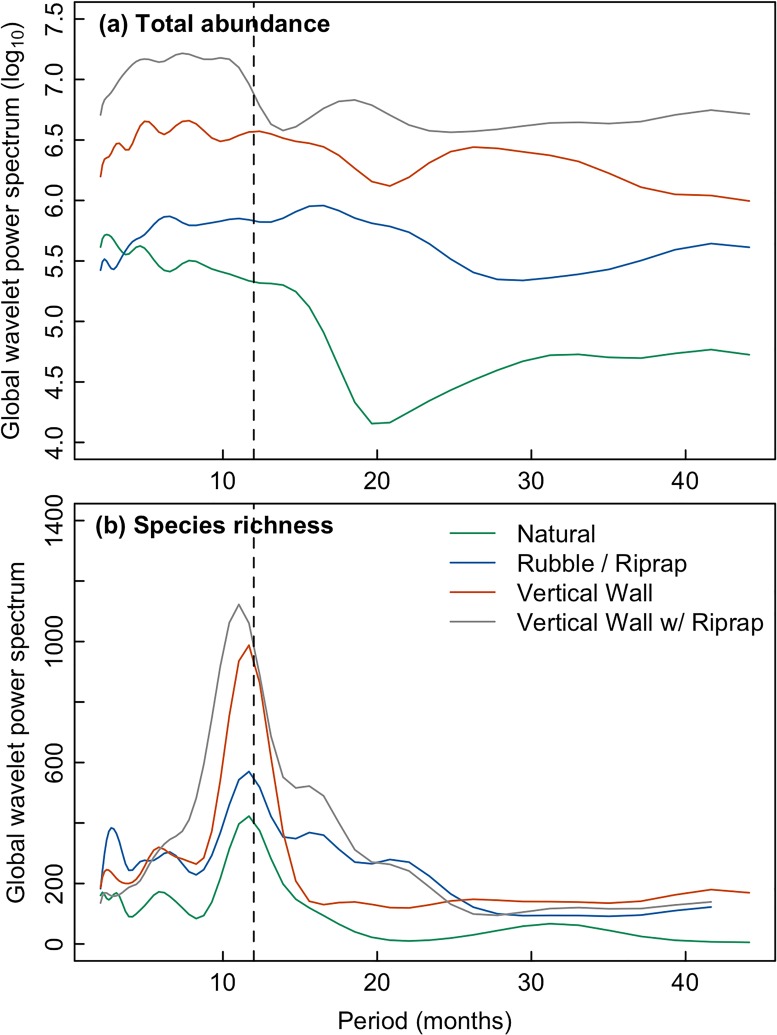
Fig 4. Global wavelet power spectrum of monthly average abundance and species richness by shoreline type.
The global wavelet power represents the time-averaged variance of a signal (i.e., total abundance in panel [a] and species richness in panel [b]) at each period. For average abundance, wavelet analysis was performed for each species to obtain the global wavelet power spectrum. The global wavelet power spectrum was then averages across all species.

