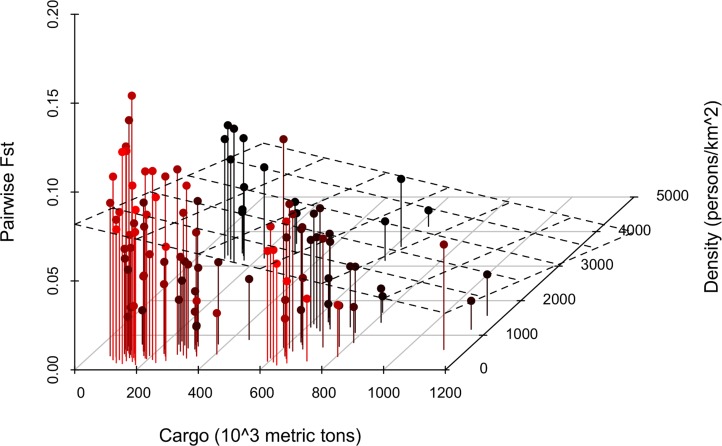
Fig 2. Three-dimensional scatter plot with regression plane that visualizes the effect of the variables called “Density” and “Cargo” on pairwise Fst values.
Both predictors are negatively correlated to Fst and the relative regression coefficients are very low in absolute value. This means that a remarkable increase in Cargo and Density is necessary to cause a unit decrease in Fst values. The interpretation is that where cargo shipments are intense and human population is dense Ae. aegypti are more genetically similar. This suggests an influence of human transportation on mosquitos’ migration. Refer to Table 2 for detailed description of the variables.

