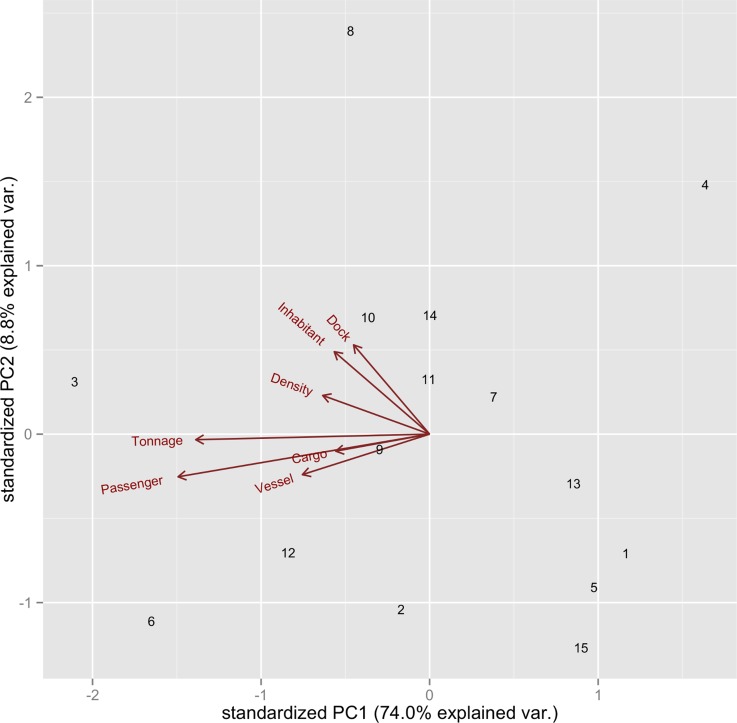
Fig 3. Principal component analysis used to summarize seven variables related to port size and connectivity; plot of the first two PCs.
Red arrows represent the vectors of the seven variables and each point in the plot is a port (Fig 1 and Table 1). The direction of principal component 1 (PC1) is almost opposite to the variables and it explains 74% of the total variance in the dataset; therefore, ports with low values of PC1 were considered big and highly connected (and vice versa). Refer to Table 2 for a detailed description of each variable.

