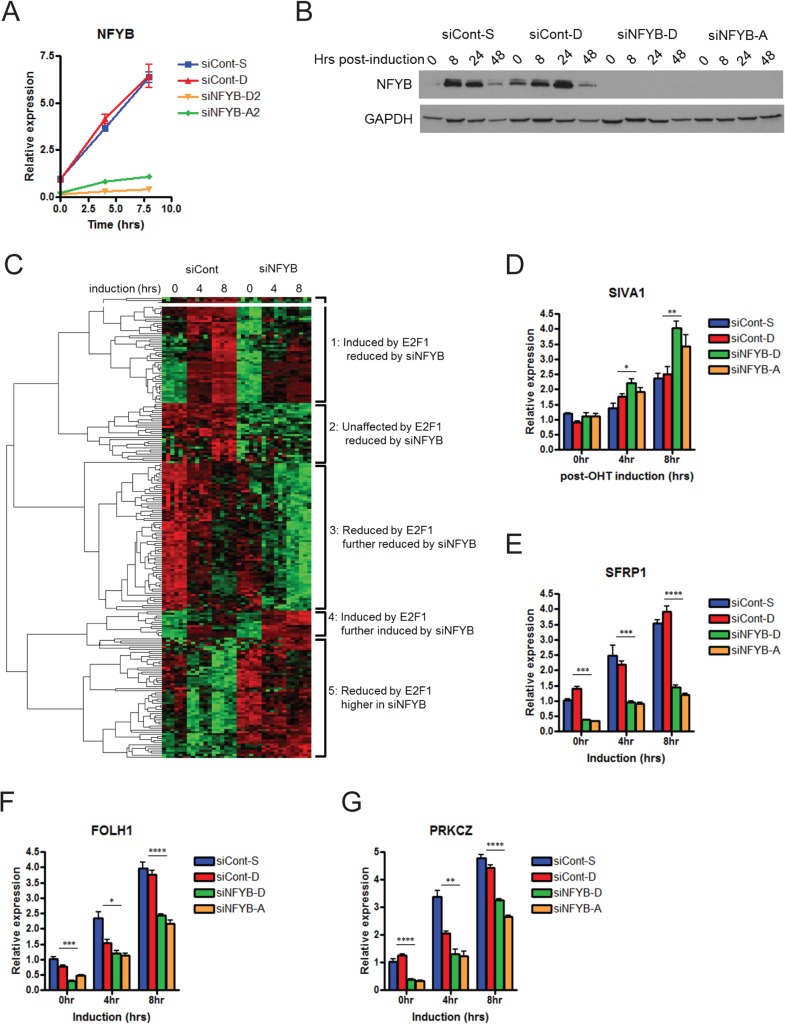
Fig 2. Identification of NFYB-dependent E2F1 target genes.
(A) Real-time PCR analysis of NFYB mRNA levels following siRNA transfection. U2OS ER-E2F1 cells were transfected with two siRNAs targeting NFYB or two negative control siRNAs at 100nM. Cells were serum starved for twenty four hours followed by 80nM OHT induction for four or eight hours. (B) Western blot analysis of NFYB protein levels following E2F1 activation. U2OS ER-E2F1 cells transfected with siRNA targeting NFYB or control were serum starved for twenty four hours followed by OHT induction at eight, twenty four, and forty eight hours. Lysates were analyzed by SDS-PAGE/Western blot and probed with anti-NFYB and anti-GAPDH antibodies (loading control). (C) Microarray analysis of the effect of NFYB knockdown on E2F1-mediated transcription. Samples were processed in the same manner as in Fig 2A and analyzed using Human U133A 2.0 expression microarrays. Heatmap represents the results of hierarchical clustering of 224 probes that showed at least 1.3-fold increase or 0.7-fold decrease in expression of compared to control following NFYB knockdown at eight hours. Real-time PCR validation of target gene expression decrease for SIVA1 (D), SFRP1 (E), FOLH1 (F), and PRKCZ (G) following NFYB knockdown. Samples were processed in the same manner as Fig 2A. * denotes p<0.05, ** denotes p<0.01, *** denotes p<0.001, **** denotes p<0.0001.

