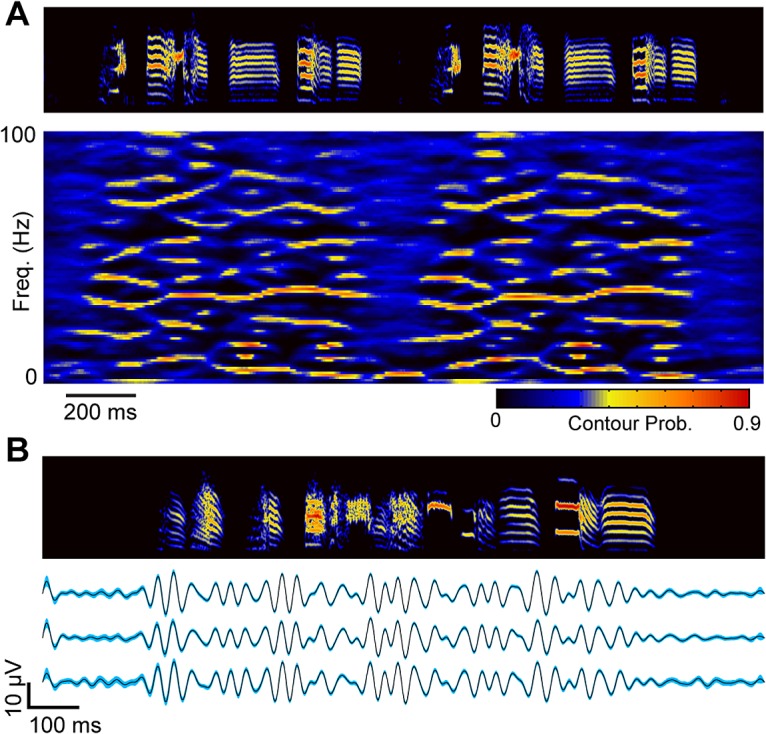
Fig 3. Stereotyped network activity during vocal production in songbird premotor cortex area HVC.

a, Spectral density images [40] reveal the time-frequency structure in the LFP during singing (n = 64 song-aligned trials. No time warping was applied). In a spectral density image, color indicates the probability density of time-frequency structure (see Materials and Methods). Reliable time-frequency structure emerges as the bird begins to sing and disappears during the short gap between song motifs. b, Trial-averaged band-passed LFPs (25–35 Hz) from a single electrode on three consecutive days (n = 130 trials for the top trace, and n = 200 trials for the middle and bottom traces). Shading indicates 99% bootstrap confidence interval. See also S2 Fig.
