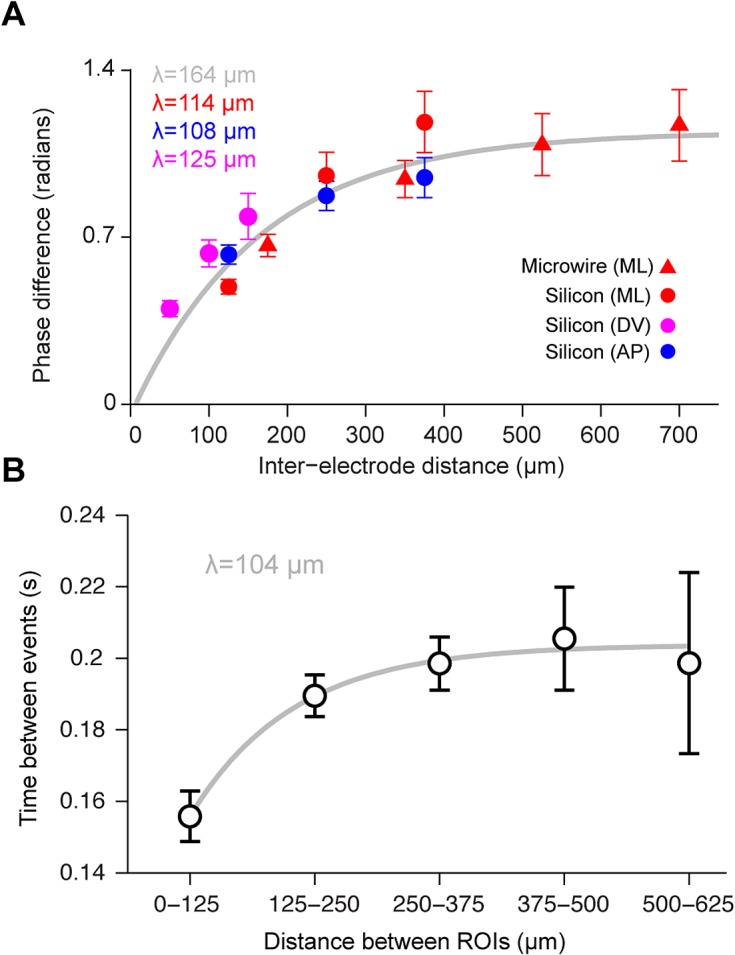
Fig 6. LFPs in the 25–35 Hz band and calcium events are correlated over a 100 μm length scale.

a, Shown is the average phase difference between LFPs recorded on two separate electrodes as a function of distance along the dorsoventral (DV) (n = 70), mediolateral (ML) (n = 57), and anterior-posterior (AP) axes (n = 48). This data was collected using four-shank silicon probes (Neuronexus) and commercial microwire probes (TDT). b, Average difference in event times between ROIs observed using calcium imaging. The equation M(1 − exp(−d/λ))+C was fit to data in both a and b using a least squares procedure. In a, the data from each of the axes was separately fit (matching colors); the gray line represents the fit using data combined from the AP and ML axes. Error bars represent standard error of the mean (SEM). See also S5 Fig.
