
Fig 2. STEMI Incidence as a function of time of symptom onset.
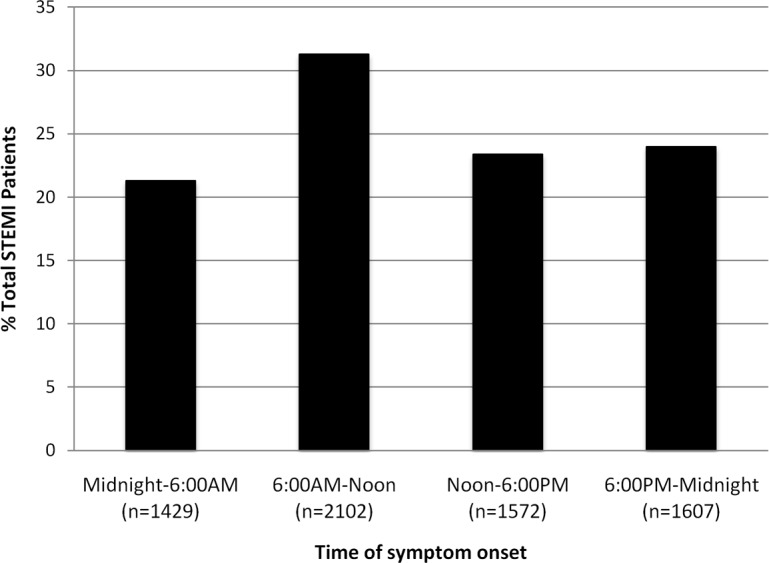
Bar chart showing number of patients with symptom onset within each of the 4 pre specified time intervals. The peak incidence of symptom onset was observed in the 6:00-noon period (P<0.001).