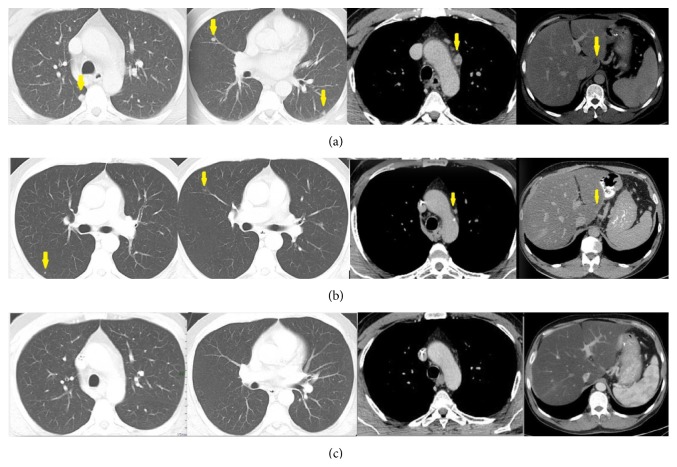
Figure 1.
CT scan, axial images, at the same level, at the beginning of the therapy (a), after three cycles of chemotherapy (b) showing partial response (PR), and after the seventh cycle (c) in competence with complete response (CR). Yellow arrows indicate the pulmonary nodules (first two images) that are easily recognized at the first scan, are faintly differentiable at the following, and have disappeared at the final. In the remaining images, arrows indicate the pathologic mediastinal lymph node (third image) and the liver lesion.

