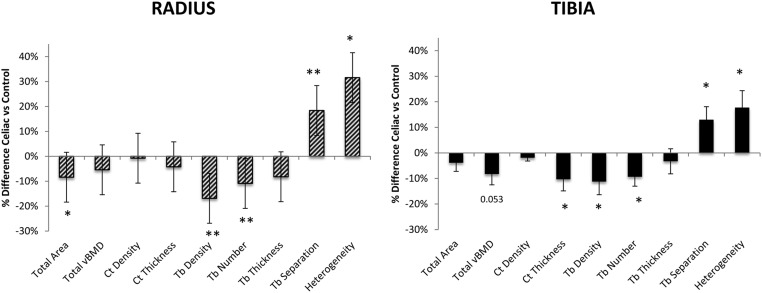
Figure 2.
Comparison of the percentage difference ± SEM in vBMD and microarchitecture by HR-pQCT in celiac and control subjects at the radius (above) and tibia (below). *, P < .05, **, P < .01. Ct Density (cortical density); Ct Thickness (cortical thickness); Heterogeneity (trabecular network heterogeneity); Tb. Density (trabecular density); Tb Number (trabecular number); Tb Separation (trabecular separation); Tb Thickness (trabecular thickness); Total vBMD (total density).

