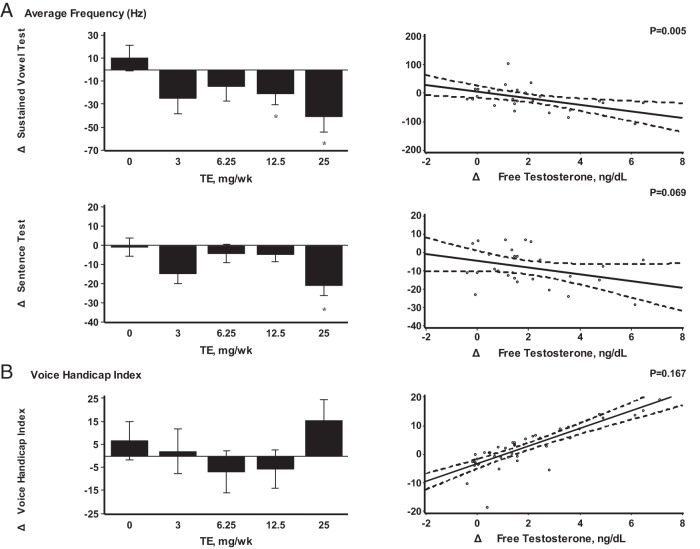
Figure 1.
A, Average frequency (hertz). B, VHI. A and B, In the bar graphs on the left, data represent absolute mean changes ± SE from baseline to end of the study for each treatment group. *, A significant difference between mean on-treatment change in dose group vs placebo at the 0.05 α levels. Scatterplots on the right show linear regression line with 95% confidence intervals as a function of change in free T levels adjusted to baseline value of outcome. The P values displayed are from significance test of no association. Hz, Hertz; TE, T enanthate.

