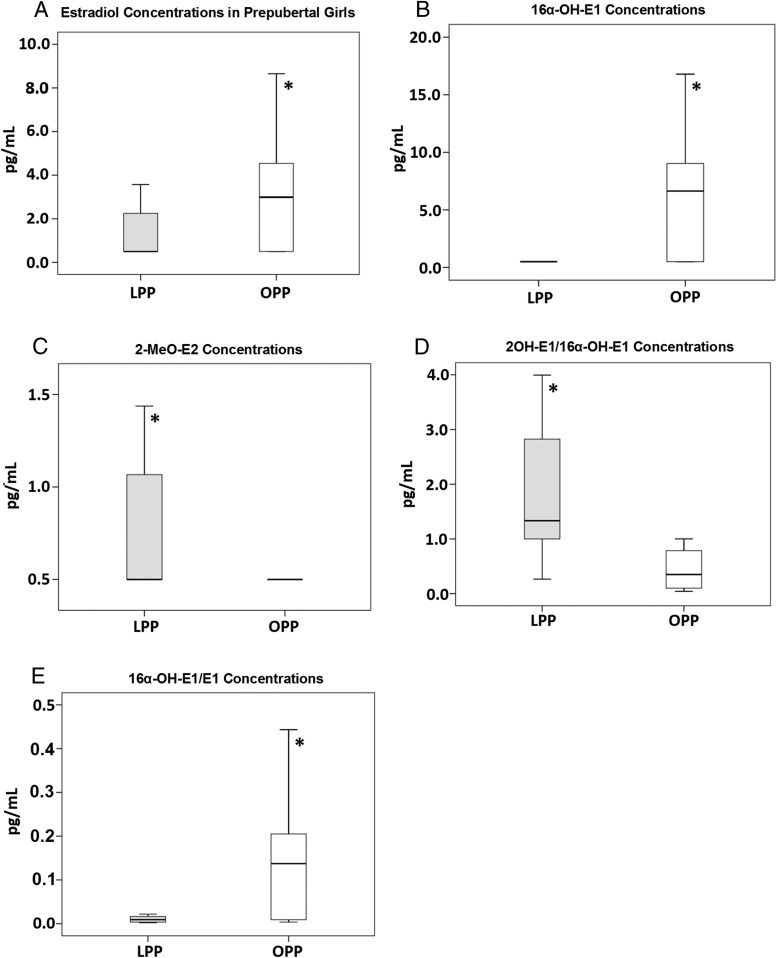
Figure 2.
Comparison of the median concentrations of estrogen and metabolites in lean (gray bars) and obese (white bars) prepubertal girls: E2 (A) estradiol (P = .04), 16α-OH-E1 (B) (P = .007), 2-MeO-E2 (C) (P = .012). D, Ratios of 2OH-E1/16α-OH-E1 [lean: 2.11 (1.9, 3.85); obese: 0.602 (0.13, 1.0)]. E, Ratio of 16α-OH-E1 to E1 in the same cohorts [lean: 0.014 (0.004, 0.02); obese: 0.139 (0.009, 0.27), P = .014].

