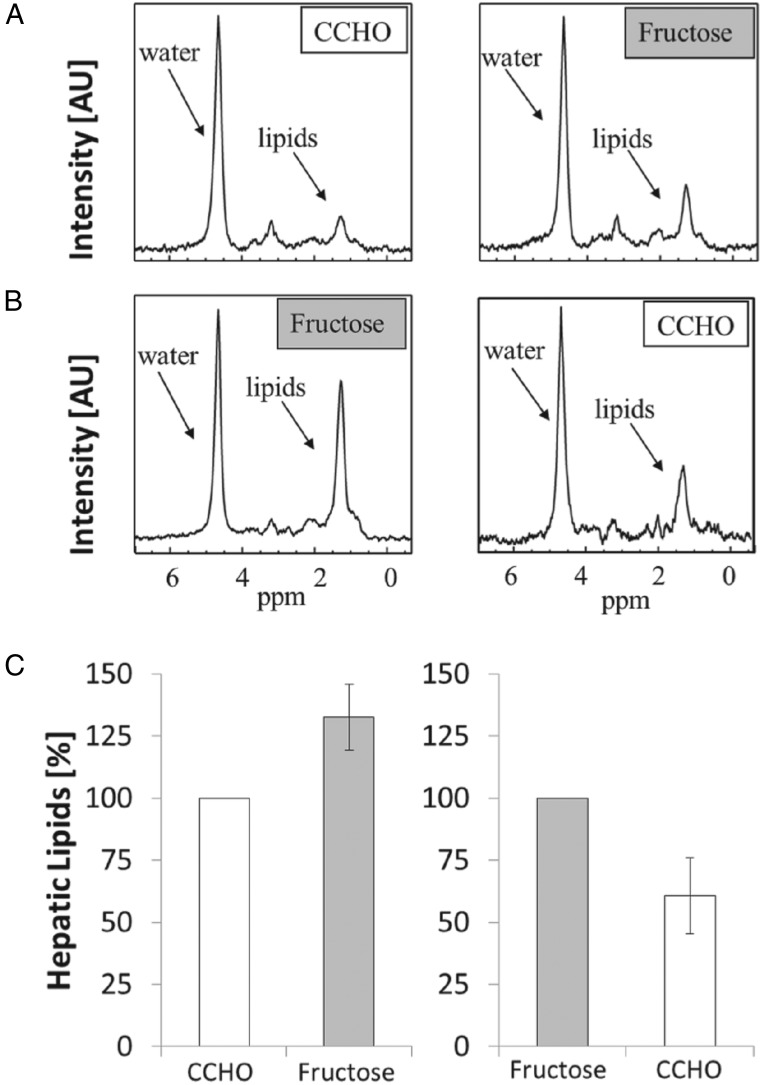
Figure 4.
Liver fat, measured by MRS, was higher with the high-fructose diet than the CCHO diet, regardless of diet order. A, MR spectra from a representative participant after the CCHO diet, then after the high-fructose diet, demonstrating the increase in the lipid peaks with fructose. B, MR spectra from another participant with the opposite diet order. In both cases, the lipid peaks are higher with the fructose diet than with the CCHO diet. All spectra are scaled to the water levels. C, Median values for liver fat were significantly higher with the high-fructose diet when compared with the CCHO diet (P = .016). Error bars show first and third quartiles. All participants showed higher liver fat after the high-fructose diet vs the CCHO diet.

