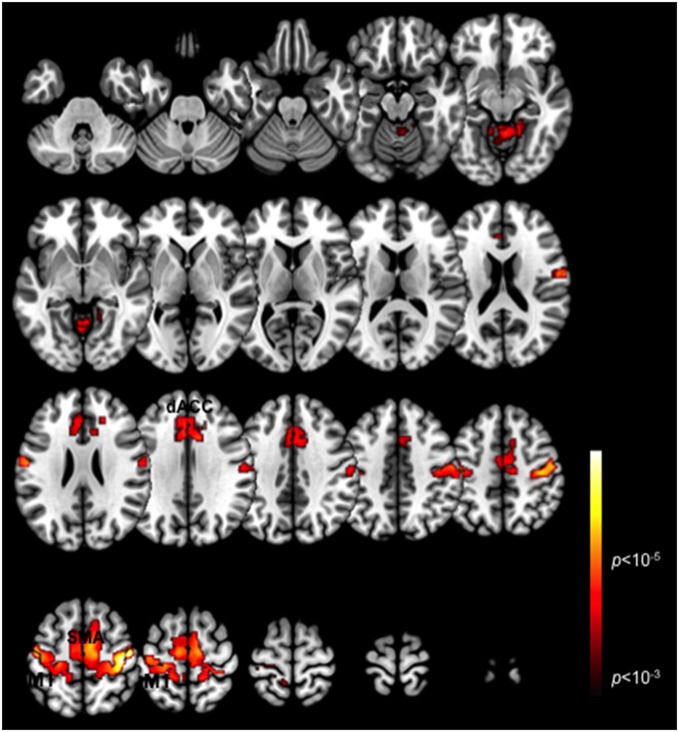
Figure 1.
Task-related BOLD activation maps. Activation patterns are shown for the conjunction of the two task variants (Periodic and Pseudo-random) averaged across participants. Significant activation clusters (p < 0.01, cluster level) are overlaid on a mosaic of axial views that reveal task-related activations in the dACC, SMA, M1 and the cerebellum.

