
Figure 3.
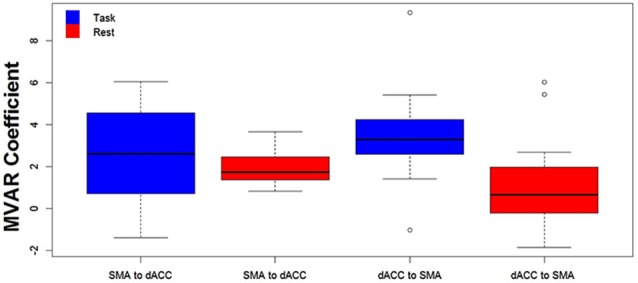
The distribution across subjects for both directions between the 2 ROIs (SMA to dACC, dACC to SMA) and for Task (blue) and Rest (red) conditions, as box plots corresponding to the bar plots in Figure 2. Note that the distribution for the influence from dACC to SMA during the Task is both more compact than and elevated above the distribution during Rest.