Figure 1.
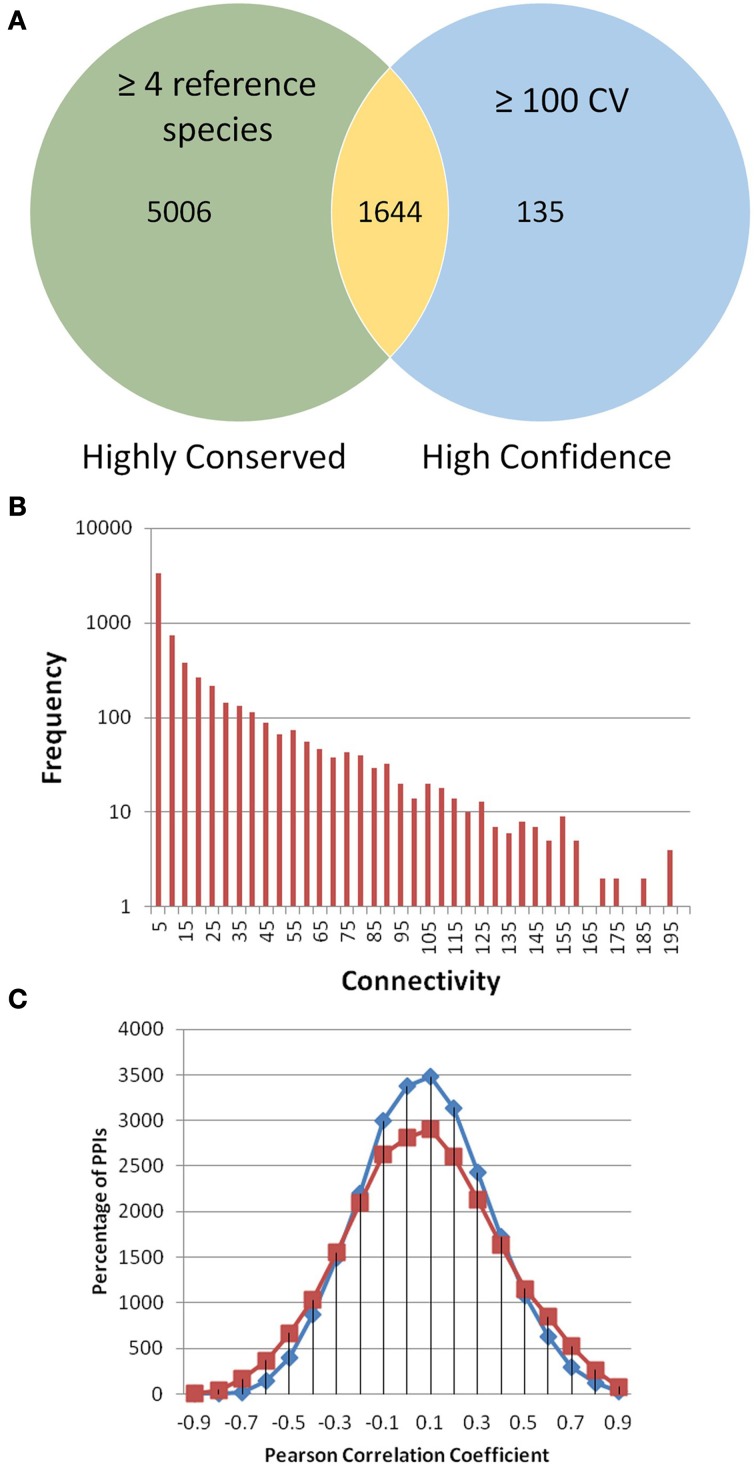
PiZeaM toplogy and co-expression. All unique interactions in PiZeaM (merged one-to-one and many-to-many orthology) were analyzed. (A) Highly conserved interactions with interologs from four or more different reference species interactomes were compared to interactions with greater than or equal to a confidence value (CV) 100. The minimum CV of an interaction with 4 reference species is 16. Larger CVs indicate additional support from different experimental methodologies or replication. (B) Frequency distribution of proteins with increasing numbers of unique interacting partners (including self-interaction) is plotted on a log-linear graph. (C) Frequency distribution of gene transcript expression (Pearson correlation of M-values from 68 microarrays) for interacting protein pairs (red) and random pairs of proteins from those found in the interactome (blue). Random interactions are statistically significantly different from nonrandom interactions (P-value of 9.53644 × 10−39 in a student t-test), although the average correlation coefficient of both distributions is similar, observed correlations were more widely spread at both high positive and negative ends.

