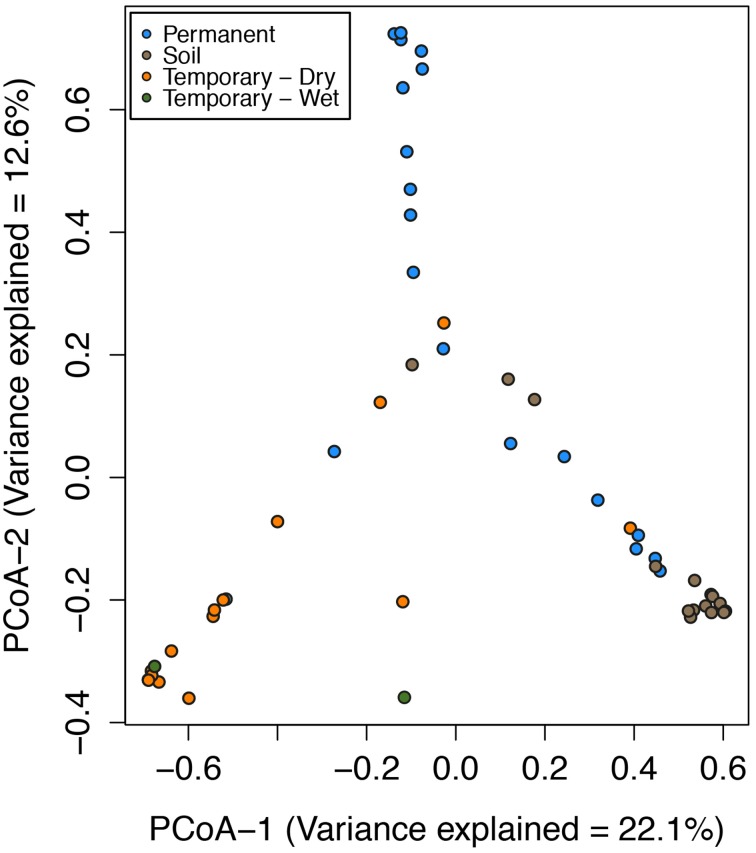
Figure 2.
Ordination of the first two axes of the principal coordinate analysis (PCoA) of microbial community composition Bray-Curtis distances for the Speed River sites. Indicated are communities from multiple dates at the permanent stream, temporary stream, and watershed soils. Points closer together in the plots indicate similar community composition than that those farther apart. Variance explained in PCoA Axis 1 = 22.1% and PCoA Axis 2 = 12.6%.

