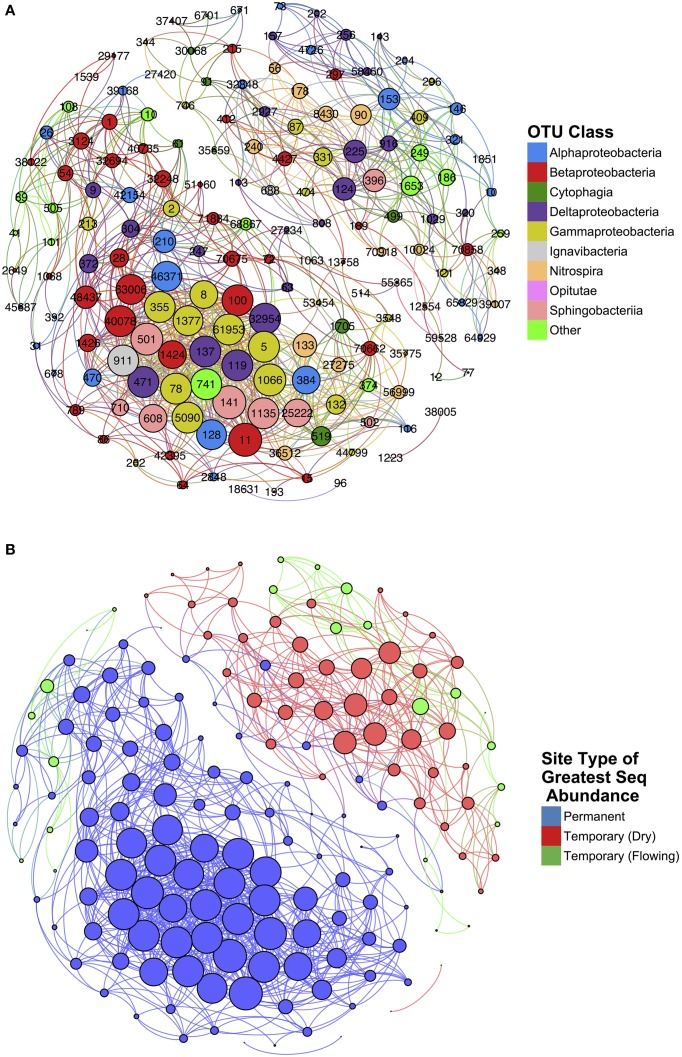
Figure 7.
Results of network analysis conducted on temporary and permanent stream samples. Nodes represent individual OTUs and edges represent significant spearman correlations (ρ > 0.75 and p < 0.05). Node size is determined by weight of that node (i.e., the number of edges connected). Nodes are color-coded according to (A) class and (B) the site type for which that OTU is most abundant.

