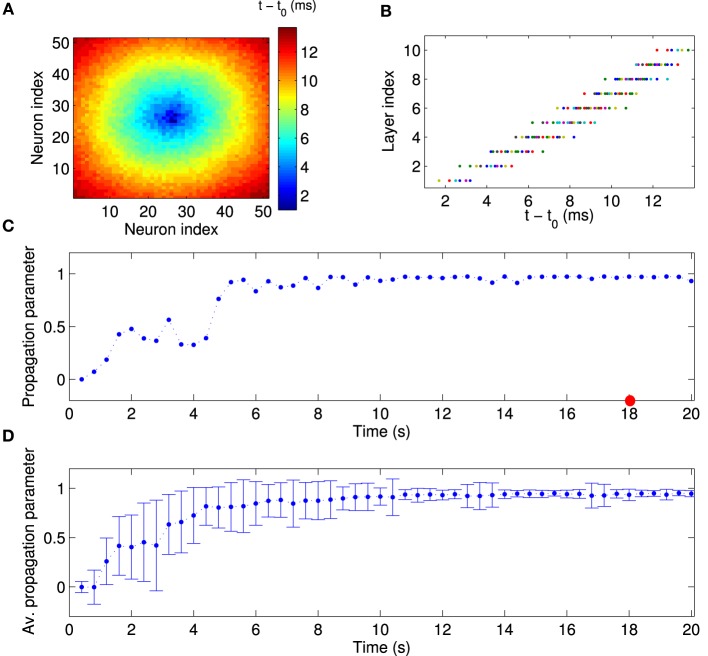
Figure 4.
Quantitative analysis of synchronous activity propagation. (A) One particular population burst of activity propagation in the stationary state. Colors indicate the spike time of each neuron relative to the beginning of the population burst (t0 = 18 s). Note how the activity propagates from the first layer (high-frequency neurons) to higher layers (compare to Figure 1C). (B) Direct comparison of spike time and assigned layer index for each neuron, for the same time window as in (A). Neurons indeed fire sequentially according to their layer index. Since neurons in the same layer also fire synchronously, activity in our network propagates much like in synfire chains. Note that this synchronous propagation emerged in our network in a self-organized manner and was not hand-tuned. To quantitatively measure synchronous activity propagation in the network, we calculated the rank-order correlation between layer index and spike time (propagation parameter). For instance, the propagation parameter in this example is about 0.98 (red circle in C). (C) The propagation parameter as a function of time for one example network. In this case, activity propagation is established after about 5 s. The fluctuations are reduced after 10 s. (D) The propagation parameter averaged across 50 simulations with different random input currents. Errorbars indicate the standard deviation. It decreases as the synchronous propagation in the network stabilizes after about 10 s.

