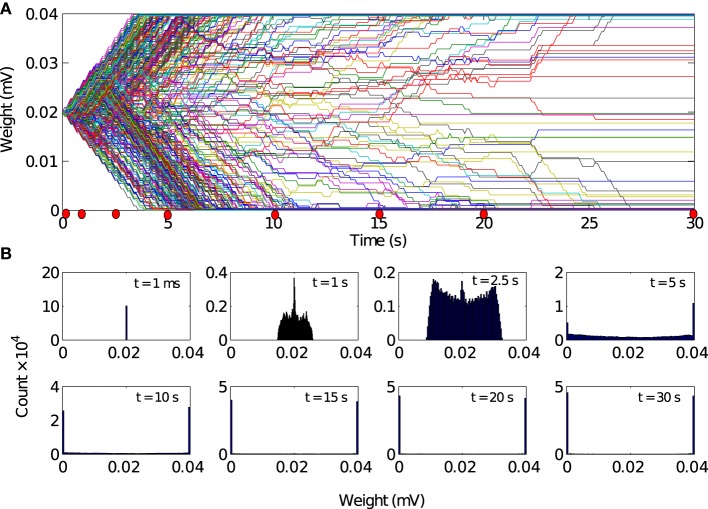
Figure 5.
Evolution of synaptic weights driven by local excitation. (A) Results are shown for 500 randomly selected synapses. Most weights (about 90%) converged toward the limiting values of 0 mV and 0.04 mV. (B) Histogram of the synaptic weight distribution at the different timepoints marked by red dots in A. The distribution of synaptic weights converge from delta-function distribution to a stable bimodal distribution. There are no apparent changes in the weight distributions between t = 20 s and t = 30 s. So we conclude that the network has reached a steady state after 20 s of simulation time.

