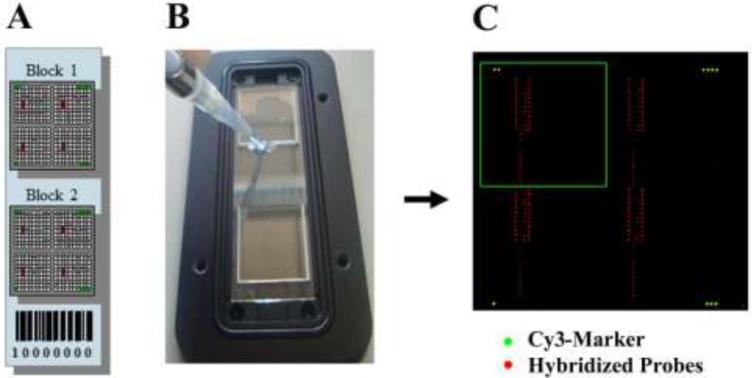
Figure 2.
(A) Schematic overview of a microarray slide consisting of two blocks. Each block has four identical grids of probes; (B) Glass slide during loading procedure of a hybridization mixture; (C) Visualization of an hybridized slide after scanning: the green spots indicate the Cy3-Marker spotted at the four corners of the slide; the red spots indicate the positions where a fluorescent fragment of Amphora coffeaeformis SIT gene recognized the complementary oligonucleotide probes; the green square indicates one of the four sectors of one block.

