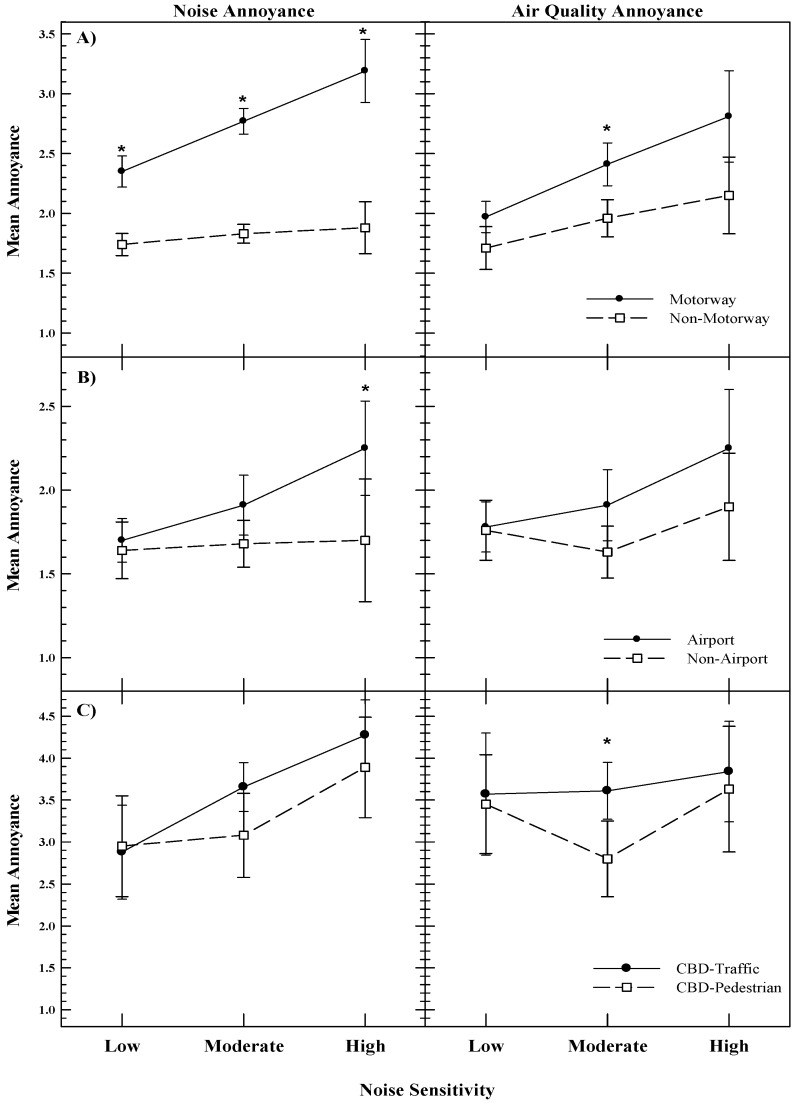
Figure 1.
Mean annoyance to noise and air pollution as a function of self-reported noise sensitivity for samples collected in two New Zealand cities: Auckland (top and bottom panels) and Wellington (middle panel). Whiskers are 95% confidence intervals, with asterisks indicating significant differences between means (p < 0.05). Note the different scales on the y-axes.

