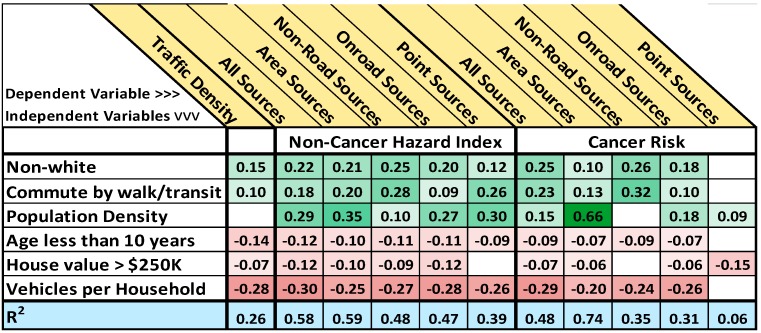
Figure 4.
Each column represents one regression equation with the dependent variable at the top of the column and the independent variables listed down the side in column one. The reported values are the statistically significant (p < 0.05) regression coefficients with R2 values in the bottom row. Blank cells were insignificant in the model. Positive coefficients are highlighted in green and negative coefficients in red with p < 0.05 for the lightest shading to p < 0.0001 for the darkest shading.

