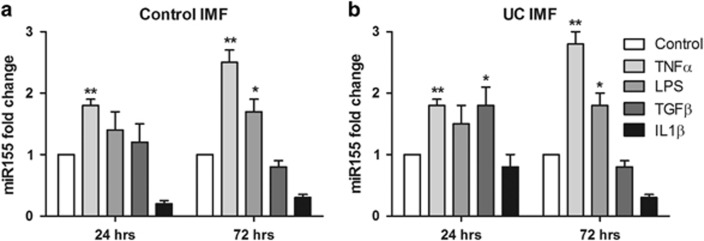
Figure 2.
TNF-α and bacterial LPS upregulate miR-155 expression in IMF. Control (a) and UC-derived (b) IMF were exposed for 24–72 h to either TNF-α, LPS, TGF-β1 or IL-1β. MiR-155 levels were quantified by real-time qPCR. Data were normalized against U6B RNA expression. Data are presented as mean±s.e.m. (n=3). **P<0.01 and *P<0.05 vs respective control.

