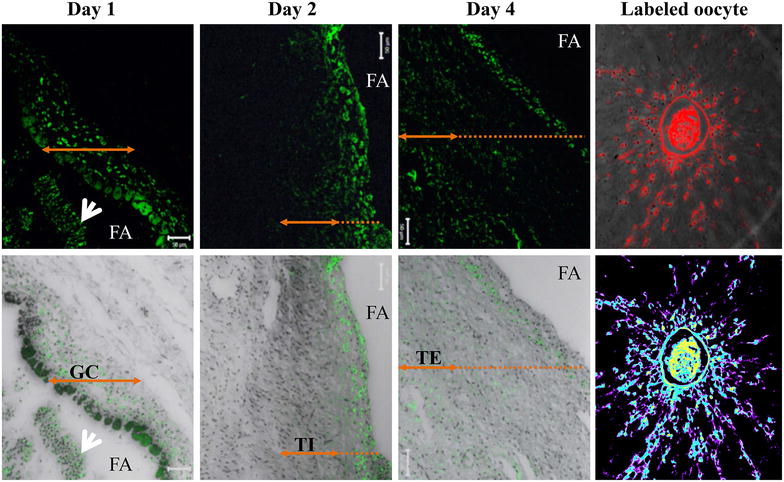
Figure 10.

Fluorescence imaging of follicular micro-sections following QD-BRET (QD) labeling. The upper panel shows the intracellular progression of the fluorescence signals of QD1− nanoparticles during culture (Day 1, 2, and 4). Fluorescence signals were mainly detected in the mural granulosa cells, surrounding the follicular cavity, on Day 1 post microinjection. The fluorescence signal progressed into the mid-section of the follicle wall (theca internal cells) on Day 2, and then the entire follicle wall, including the theca external cells on Day 4. The bottom panel represents the corresponding overlays fluorescence and visible lights. The intra-follicular COCs also incorporated the QD1− (200×). Arrows indicate the extent of tissue layers (GC granulosa cells, TI theca internal, TE theca external). The white arrows show detached and stained granulosa cells within the follicular antrum (FA).
