
Figure 12.
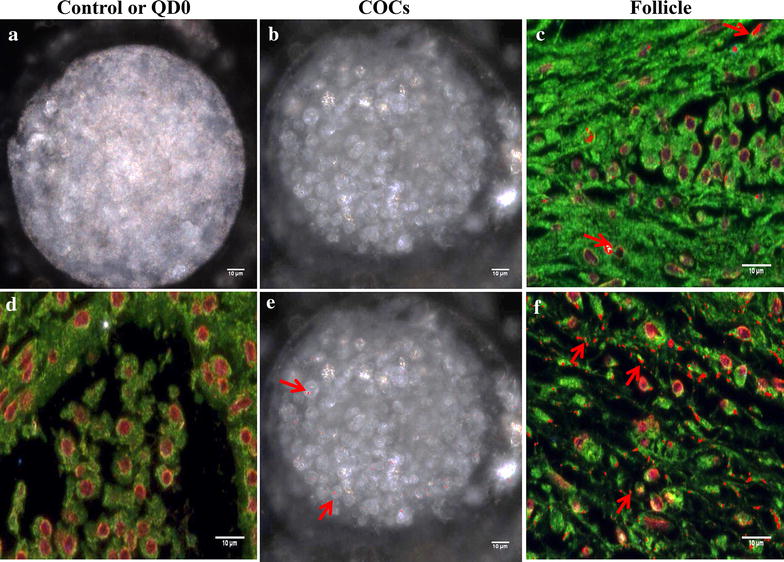
Hyperspectral fluorescence imaging of QD-BRET (QD)-labeled COCs and ovarian follicles. Micrographs show samples that were labeled with QD1− (b, e) and QD1+ (c, f). Control samples (a, d) were used to remove false positive signals and validate spectral libraries, as indicated in Figure 11b. Hyperspectral images were taken and matched to the spectral libraries to map the presence and location of QD1− and QD1+ in COCs (b, c, respectively) and follicle sections (e, f, respectively). Red arrows indicate fluorescence signals in pseudo-red color. No fluorescence signals were seen in the controls (a, d).